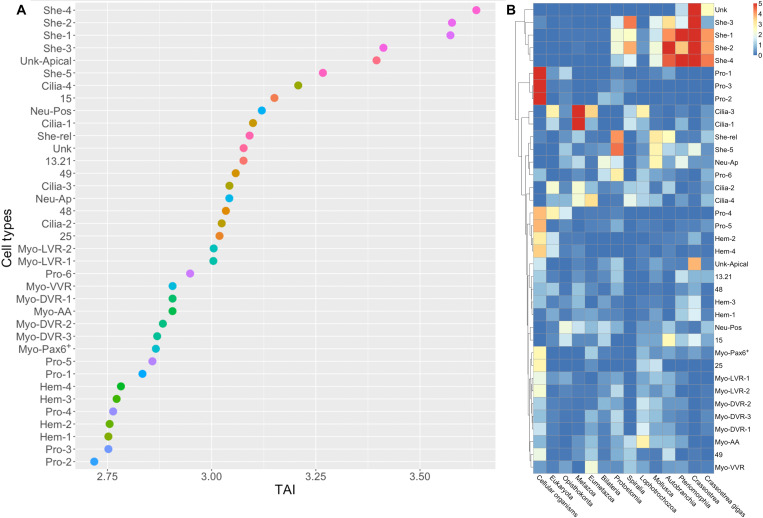
Fig. 3. Gene age analyses in different cell types of the oyster larva show that shell gland cells have a young gene signature.
(A) Transcriptome age indices (TAI) for different cell types; smaller TAI values correspond to “older” gene ages. Gene age is inferred using a phylostratigraphy approach; the TAI is then calculated on the log-transformed gene average expression per cluster. (B) Heatmap showing enrichment test −log10(P value) for marker genes phylostrata per cell type in the oyster. Enrichment was computed using a hypergeometric test applied to the number of marker genes in each cluster per phylostrata compared to the global set of expressed genes.

