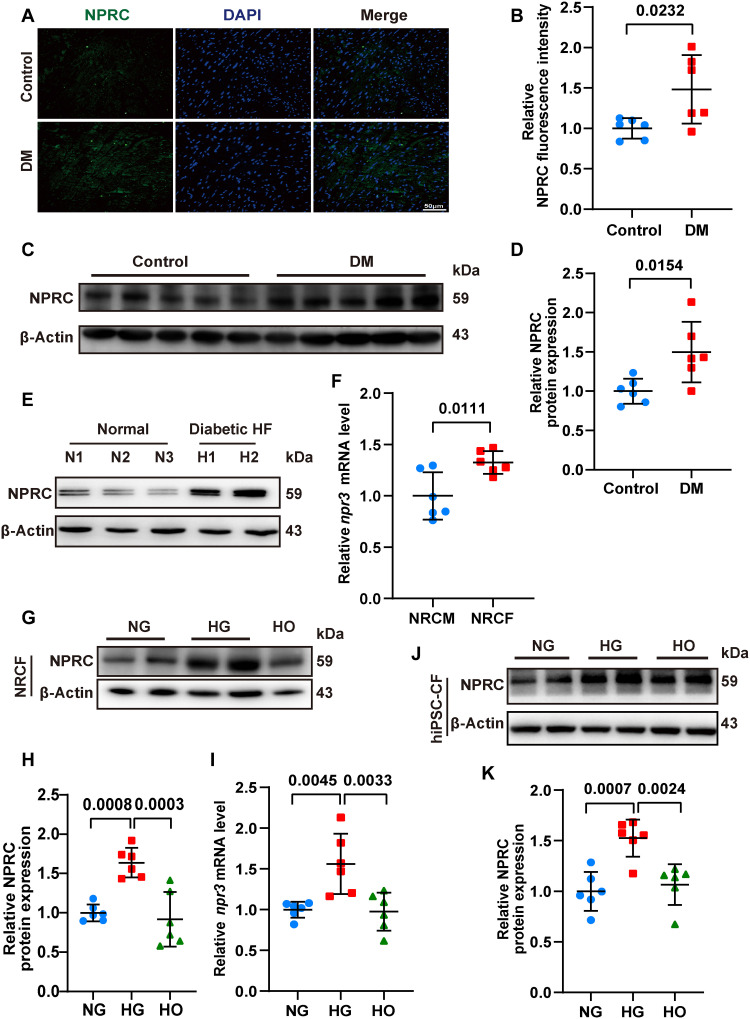
Fig. 1. NPRC expression was increased in the hearts of diabetic patients, diabetic mice, and glucose-treated CFs.
(A) Representative immunofluorescence staining of NPRC (green) in tissue sections from the left ventricle of control and diabetic mice. The nuclei were counterstained with DAPI (blue). Bar = 50 μm. (B) Quantification of fluorescence intensity of NPRC in (A). n = 6 per group. (C) Representative Western blot images of NPRC expression in the left ventricular samples from control and diabetic mice. (D) Quantification of the protein expression of NPRC in (C). n = 6 per group. (E) Western blot images of NPRC expression in human heart samples from healthy donors and patients with DM and HF. (F) Relative mRNA levels of npr3 in primary NRCMs and NRCFs. n = 6 per group. (G) Representative Western blot images of NPRC expression in NRCFs treated with normal concentration of glucose (NG), high concentration of glucose (HG), and high osmotic medium (HO). (H) Quantification of the protein expression of NPRC in (G). n = 6 per group. (I) Relative mRNA levels of npr3 in NRCFs treated with NG, HG, or HO. n = 6 per group. (J) Representative Western blot images of NPRC expression in hiPSC-CFs treated with NG, HG, or HO. (K) Quantification of the protein expression of NPRC in (J). n = 6 per group. Normal distributions were tested by Shapiro-Wilk method. Unpaired two-tailed Student’s t tests were applied in (B), (D), and (F). One-way ANOVA was applied in (H), (I), and (K).

