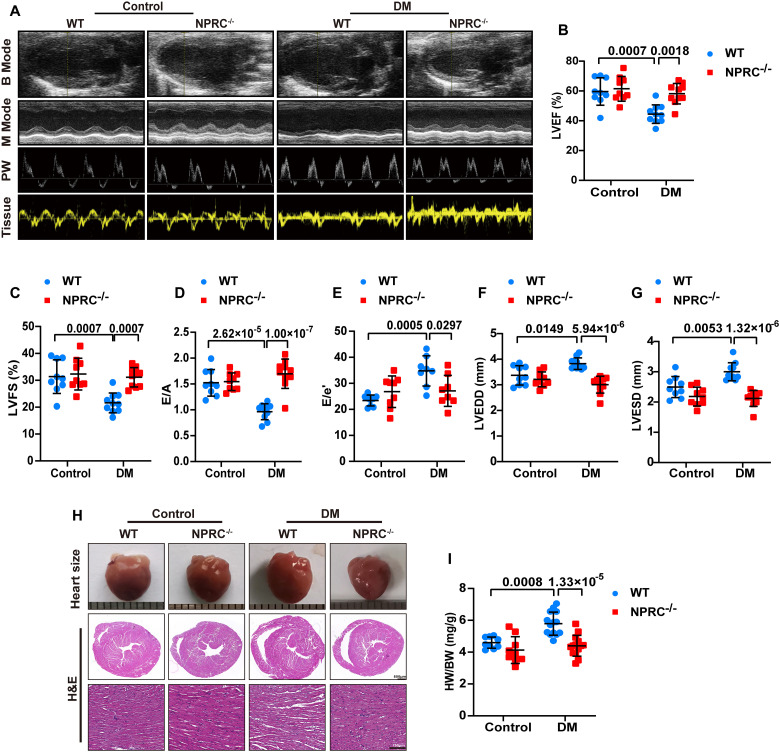
Fig. 2. NPRC deficiency improved left ventricular function and remodeling in diabetic mice.
(A) Representative echocardiographic images for four groups of mice. B Mode represents a two-dimensional echocardiogram showing left ventricular long-axis view; M Mode represents M-mode echocardiogram showing left ventricular dimensions; PW represents pulse-wave Doppler echocardiogram depicting diastolic mitral flow; Tissue represents tissue Doppler echocardiogram displaying mitral annular velocities. (B) Quantification of left ventricular ejection fraction (LVEF) in four groups of mice. n = 9 to 10 per group. (C) Quantification of left ventricular fractional shortening (LVFS) in four groups of mice. n = 9 to 10 per group. (D) Quantification of the ratio of early to late diastolic mitral flow velocities (E/A) in four groups of mice. n = 9 to 10 per group. (E) Quantification of the ratio of early diastolic mitral flow to early diastolic mitral annular velocities (E/e′) in four groups of mice. n = 8 to 9 per group. (F) Quantification of left ventricular end-diastolic diameter (LVEDD) in four groups of mice. n = 9 to 10 per group. (G) Quantification of left ventricular end-systolic diameter (LVESD) in four groups of mice. n = 9 to 10 per group. (H) Representative photographs of the hearts from four groups of mice (the first row), cross-sectional images of hematoxylin and eosin (H&E) staining at the papillary muscle level of the hearts (the second row, scale bar, 500 μm), and H&E-stained sections of hearts from four groups of mice (the third row, scale bar, 100 μm). (I) Quantification of the ratio of heart weight (HW) to body weight (BW) in four groups of mice. n = 9 to 14 per group. Normal distributions were tested by Shapiro-Wilk method. Two-way ANOVA with Turkey’s post hoc test was used in (B) to (G) and (I).

