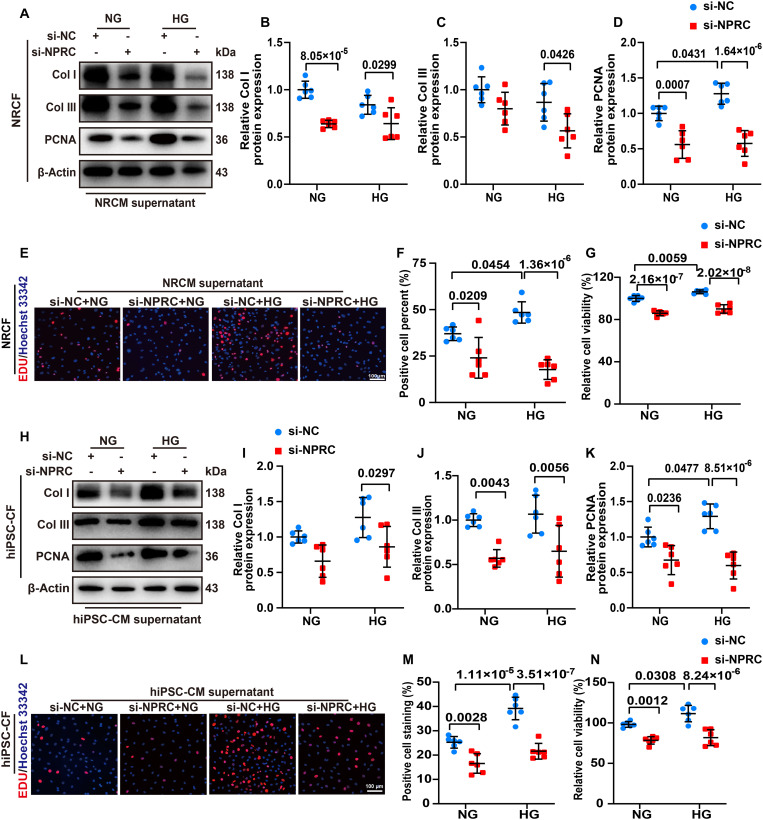
Fig. 5. NPRC deficiency in CMs inhibited collagen synthesis and proliferation of CFs in vitro.
(A) Representative Western blot images of collagen I, collagen III, and PCNA in NRCFs treated with the supernatant of NRCMs. (B to D) Quantification of the protein expression of collagen I, collagen III, and PCNA in (A). n = 6 per group. (E) Representative images of EDU (red) assays of NRCFs treated with the supernatant of NRCMs. The nuclei were stained with Hoechst 33342. Scale bar, 100 μm. (F) Quantification of EDU-positive cell percent in (E). n = 6 per group. (G) Quantification of the relative cell viability in NRCFs treated with the supernatant of NRCMs using CCK-8 assay. (H) Representative Western blot images of collagen I, collagen III, and PCNA in hiPSC-CFs treated with the supernatant of hiPSC-CMs. (I to K) Quantification of the protein expression of collagen I, collagen III, and PCNA in (H). n = 6 per group. (L) Representative images of EDU (red) assays of hiPSC-CFs treated with the supernatant of hiPSC-CMs. The nuclei were stained with Hoechst 33342. Scale bar, 100 μm. (M) Quantification of EDU-positive cell percent in (L). n = 6 per group. (N) Quantification of the relative cell viability in hiPSC-CFs treated with the supernatant of hiPSC-CMs using CCK-8 assay. Normal distributions were tested by Shapiro-Wilk method. Two-way ANOVA with Turkey’s post hoc test was used in (F), (K), and (M). Two-way ANOVA with Bonferroni post hoc test was used in (B) to (D), (G), (I), (J), and (N).

