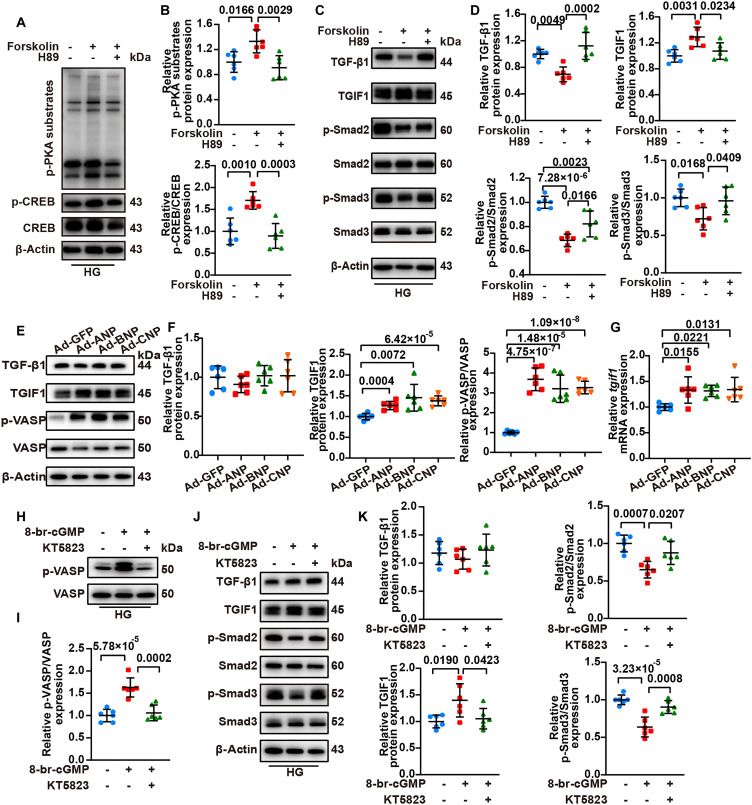
Fig. 9. Activation of cAMP/PKA or cGMP/PKG signaling increased TGIF1 expression, but cAMP/PKA activation inhibited TGF-β1 expression.
(A) Representative Western blot images of p-PKA substrates and p-CREB expression in NRCFs, which were treated with either forskolin or forskolin combined with H89 followed by HG treatment. (B) Quantification of the protein expression of p-PKA substrates and p-CREB in (A). n = 6 per group. (C) Representative Western blot images of TGF-β1, TGIF1, p-Smad2, and p-Smad3 expression in NRCFs, which were treated with either forskolin or forskolin combined with H89 followed by HG treatment. (D) Quantification of the protein expression of TGF-β1, TGIF1, p-Smad2, and p-Smad3 in (C). n = 6 per group. (E) Representative Western blot images of TGF-β1, TGIF1, and p-VASP expression in NRCFs transfected with Ad-GFP, Ad-ANP, Ad-BNP, or Ad-CNP. (F) Quantification of the protein expression of TGF-β1, TGIF1, and p-VASP in (E). n = 6 per group. (G) Relative mRNA level of tgif1 in NRCFs transfected with Ad-GFP, Ad-ANP, Ad-BNP, or Ad-CNP. n = 6 per group. (H) Representative Western blot images of p-VASP in NRCFs treated with either 8-br-cGMP or 8-br-cGMP combined with KT5823 followed by HG treatment. (I) Quantification of the protein expression of p-VASP in (H). n = 6 per group. (J) Representative Western blot images of TGF-β1, TGIF1, p-Smad2, and p-Smad3 expression in NRCFs treated with either 8-br-cGMP or 8-br-cGMP combined with KT5823 followed by HG treatment. (K) Quantification of the protein expression of TGF-β1, TGIF1, p-Smad2, and p-Smad3 in (J). n = 6 per group. Normal distributions were tested by Shapiro-Wilk method. One-way ANOVA was used in (B), (D), (I), and (K). One-way ANOVA with Dunnett’s post hoc test was used in (F) and (G).

