Figure 1.
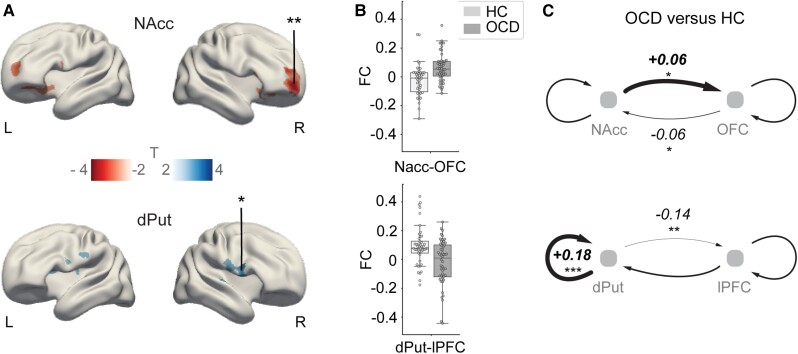
Functional and effective connectivity differences in OCD versus healthy controls. (A) Main effect of group: increased (T < 0) and decreased (T > 0) functional connectivity in OCD (|t| > 2.5). *PFWE = 0.04, **PFWE = 0.01). MNI coordinates for NAcc seed: x = ±9, y = 9, z = −8; dPut seed: x = ±28, y = 1, z = 3. R = right hemisphere; L = left hemisphere. (B) Pearson correlation values (functional connectivity, FC) between fMRI signals in the seed regions and the highlighted clusters denoted by asterisks in A. Boxes extend from first to third quartile, whiskers span 1.5 of the interquartile range and individuals’ FC values are marked by small circles. (C) Group differences in ‘effective’ connectivity between seed regions and cortical clusters depicted by asterisks in A. Plus symbols and thick lines, and minus sign symbols and thin lines indicate deviations relative to the mean across groups inferred through DCM. *Pp > 0.66 (moderate); **Pp > 0.9 (strong); ***Pp > 0.95 (very strong). OFC peak coordinates: x = 23, y = 57, z = −6; lPFC peak coordinates: x = 53, y = 13, z = 19. HC = healthy controls.

