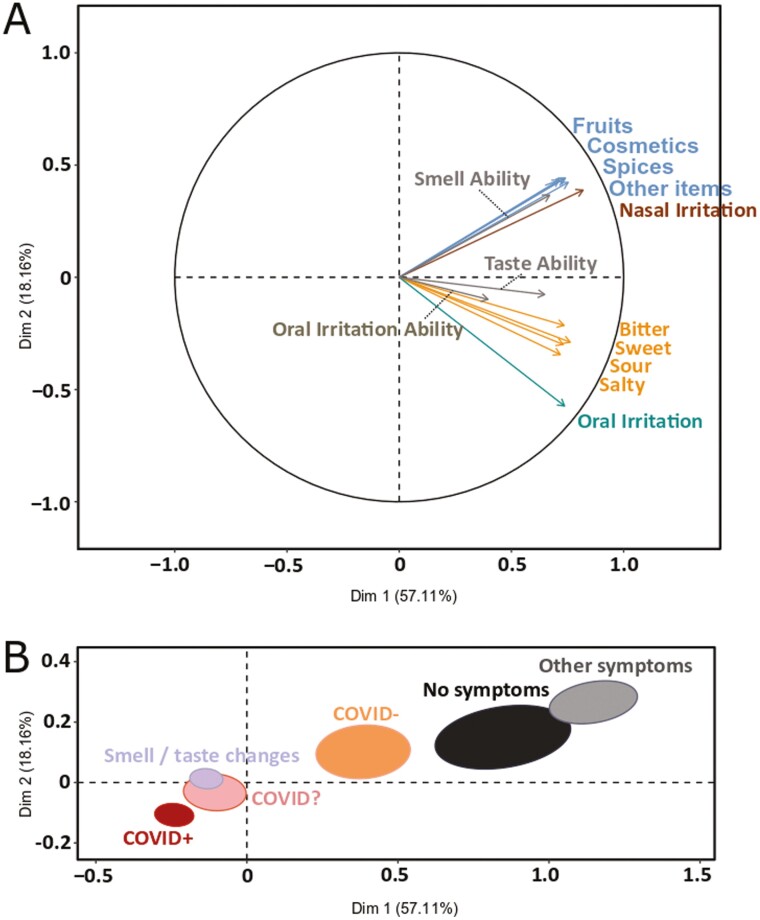
Fig. 3.
MFA on self-reported chemosensory abilities and perceived intensities. (a) Correlation circle, including all ratings. (b) Map of the six groups (COVID+, N=3,275; COVID−, N = 579; COVID?, N = 1,224; STC, N = 4,271; OthS, N = 802; NoS, N = 396) with 95% confidence ellipses. The groups are distributed based on the chemosensory profiles computed from the self-reported abilities and perceived intensities of taste, smell, and oral irritation.

