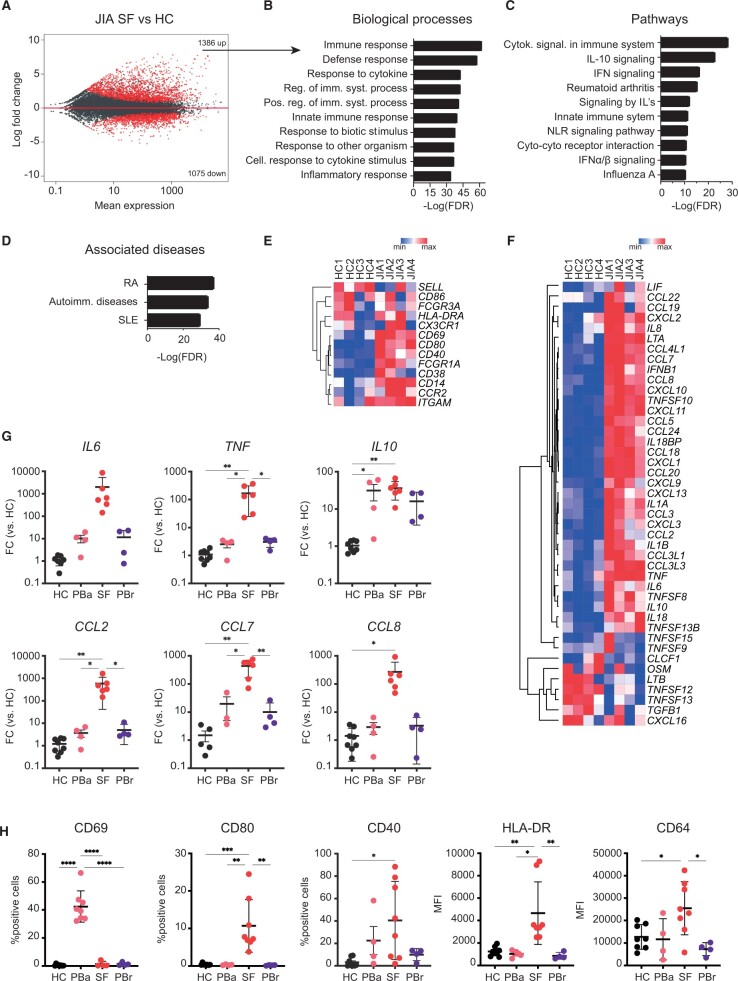
Figure 1.
Transcriptional analysis of JIA SF monocytes indicates an activated phenotype. (A) MA plot displaying genes differentially expressed between HC PB monocytes and JIA SF monocytes. Red dots indicate genes with FDR < 0.05. (B) Top 10 biological processes associated with genes that are significantly increased in JIA SF monocytes. (C) Top 10 pathways associated with genes that are significantly increased in JIA SF monocytes. (D) Top 3 diseases associated with genes that are significantly increased in JIA SF monocytes. (E, F) Heatmap demonstrating the expression of selected monocyte surface markers (E) and selected cytokines (F) and chemokines in HC PB and JIA SF monocytes. (G) Gene expression of selected cytokine and chemokines in monocytes derived from either the PB of HC, PB of JIA patients undergoing active disease (PBa), SF of JIA patients, and PB of JIA patients in remission (PBrem). (H) Protein levels of selected surface markers in monocytes derived from either the PB of HC, PB of JIA patients undergoing active disease (PBa), SF of JIA patients, and PB of JIA patients in remission (PBrem). P-values for F and G were calculated using an ordinary one-way ANOVA. *P < 0.05; **P < 0.01; ***P < 0.001. HC: healthy control; FDR: false discovery rate; PB: peripheral blood

