Figure 2.
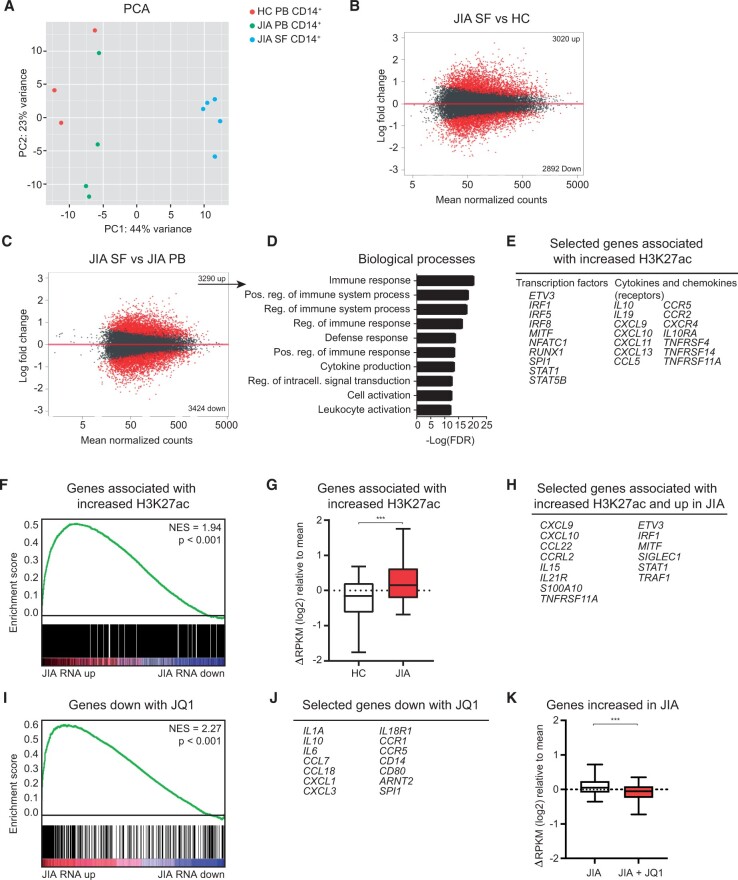
Epigenetic regulation contributes to the activated phenotype of JIA SF monocytes. (A) PCA of H3K27ac signal in HC PB, JIA PB and JIA SF monocytes. (B and C) MA plot of H3K27ac regions different between JIA SF and HC PB and between JIA SF and JIA PB. Red dots indicate H3K27ac regions with FDR < 0.1. (D) Top 10 biological processes associated with genes significantly increased in JIA SF vs JIA PB. (E) Selected genes associated with increased H3K27ac signal in JIA SF vs JIA PB. (F) GSEA of genes associated with increased H3K27ac signal in JIA SF and genes differentially expressed within JIA SF. (G) Boxplot with 5%–95% whiskers displaying △RPKM (log2) values of genes associated with increased H3K27ac signal in HC and JIA. (H) Selected genes associated with increased H3K27ac signal and increased in JIA. (I) GSEA of genes decreased with JQ1 and genes differentially expressed within JIA SF. (J) Selected genes decreased with JQ1. (K) Boxplot with 5%–95% whiskers displaying △RPKM (log2) values of genes increased in JIA monocytes treated with or without JQ1. P-values for G and K were calculated using Wilcoxon-matched pairs signed rank test. *P < 0.05; **P < 0.01; ***P < 0.001. FDR: false discovery rate; GSEA: gene set enrichment analysis; HC: healthy control; PB: peripheral blood; PCA: principle component analysis; RPKM: reads per kilobase of exon per million reads mapped

