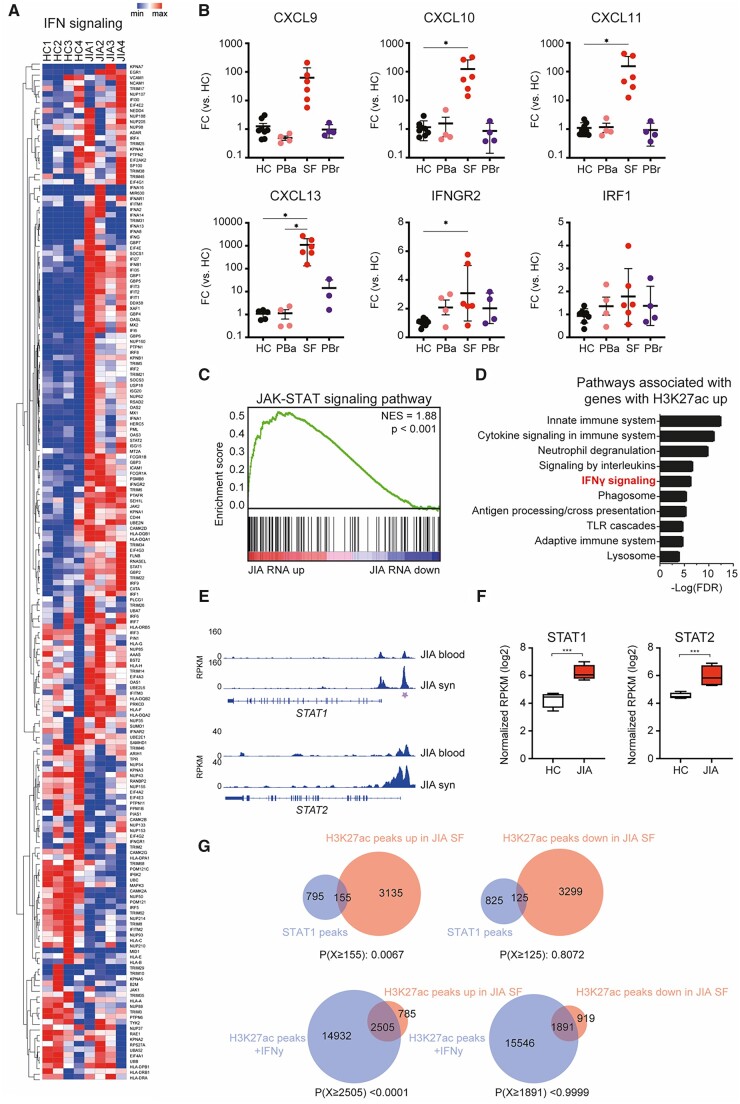
Figure 3.
IFNγ-associated genes are increased in JIA SF monocytes. (A) Heatmap demonstrating the expression of IFNγ signalling-associated genes in HC PB and JIA SF monocytes. (B) Gene expression of selected IFNγ signalling-associated genes in monocytes derived from either the PB of HC, PB of JIA patients undergoing active disease (PBa), SF of JIA patients, and PB of JIA patients in remission (PBrem). (C) Top 10 pathways associated with genes associated with an increased H3K27ac signal. (D) Gene set enrichment of JAK-STAT signalling pathway-associated genes and genes differentially expressed within JIA SF monocytes. (E) Gene track for STAT1 and STAT2 displaying H3K27ac signals for JIA PB and JIA SF. Purple asterisk indicates H3K27ac regions that are significantly different. (F) Normalized RPKM (log2) values of STAT1 and STAT2 expression in HC and JIA monocytes. (G) Venn diagrams displaying the overlap of H3K27ac peaks upregulated or downregulated in JIA SF monocytes with STAT1 or H3K27ac peaks of IFNγ-treated monocytes. STAT1 and H3K27ac data was obtained from GSE43036 (GSM1057010 and GSM1057016, respectively). P-values for B were calculated using an ordinary one-way ANOVA. P-values for E were calculated using a hypergeometric test. *P < 0.05; **P < 0.01; ***P < 0.001. HC: healthy control; PB: peripheral blood; RPKM: reads per kilobase of exon per million reads mapped

