Figure 4.
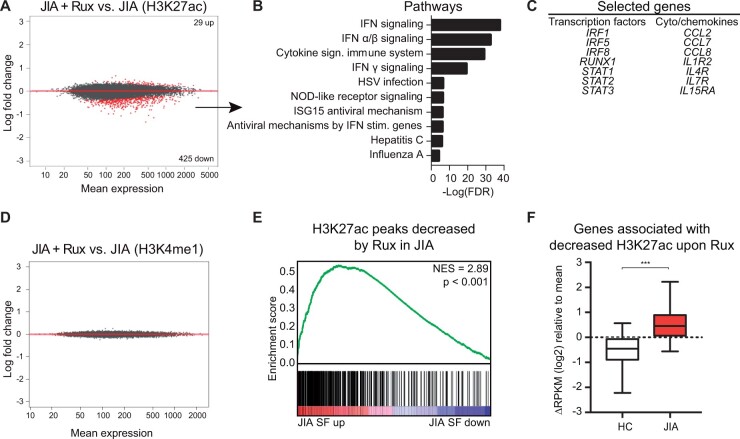
Ruxolitinib alters JIA SF monocytes at the epigenetic level. (A) MA plot of H3K27ac regions different within JIA SF monocytes after ruxolitinib treatment. Red dots indicate genes with FDR < 0.1. (B) Top 10 pathways associated with genes significantly decreased by ruxolitinib. (C) Selected genes significantly decreased by ruxolitinib. (D) MA plot of H3K4me1 regions different within JIA SF monocytes after ruxolitinib treatment. Red dots indicate genes with an FDR < 0.1. (E) Gene set enrichment analysis of H3K27ac peaks decreased by ruxolitinib in JIA and H3K27ac peaks different in JIA SF. (F) Boxplot with 5%–95% whiskers displaying △RPKM (log2) values of genes associated with a decreased H3K27ac signal in JIA monocytes after ruxolitinib treatment. P-value for E was calculated using a Wilcoxon-matched pairs signed rank test. *P < 0.05; **P < 0.01; ***P < 0.001. JIA: juvenile idiopathic arthritis; RPKM: reads per kilobase of exon per million reads mapped; SF: synovial fluid

