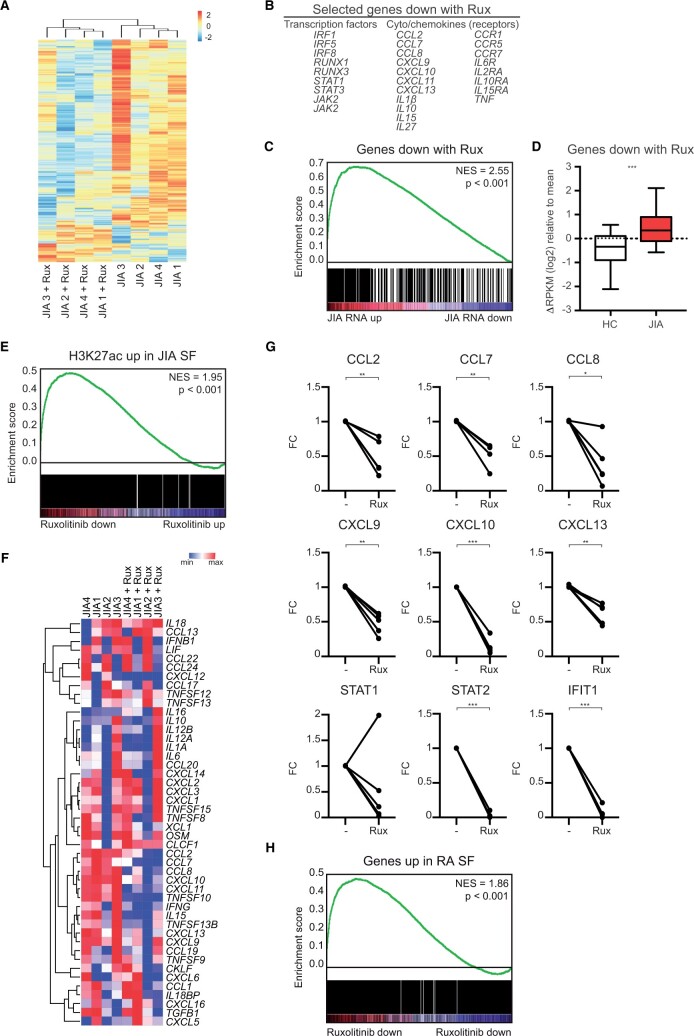
Figure 5:
Ruxolitinib decreases the activated phenotype of JIA SF monocytes. (A) Supervised clustering analysis based on differences in gene expression in JIA SF monocytes after treatment with ruxolitinib. (B) Selected genes downregulated by ruxolitinib. (C) Gene set enrichment analysis of genes downregulated by ruxolitinib, and genes differentially expressed in JIA SF monocytes vs HC monocytes. (D) Boxplot with 5%–95% whiskers displaying △RPKM (log2) values of genes decreased by ruxolitinib in signal in HC and JIA monocytes. (E) Gene set enrichment analysis of genes associated with an increased H3K27ac signal in JIA SF monocytes and genes affected by ruxolitinib treatment in JIA SF monocytes. (F) Heatmap demonstrating the expression of selected cytokines and chemokines in JIA SF monocytes with and without ruxolitinib treatment, PB and JIA SF monocytes. (G) Gene expression of selected genes in JIA SF monocytes affected by ruxolitinib treatment. P-values for D and G were calculated using a Wilcoxon-matched pairs signed rank test. (H) Gene set enrichment analysis of genes increased in RA SF monocytes and genes affected by ruxolitinib treatment in JIA SF monocytes. *P < 0.05; **P < 0.01; ***P < 0.001. HC: healthy control; PB: peripheral blood; RA: rheumatoid arthritis

