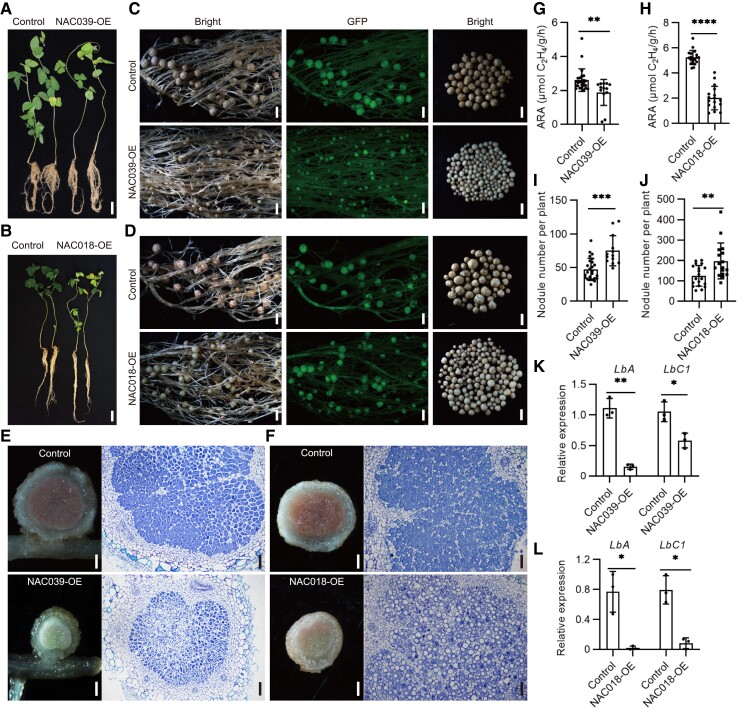
Figure 2.
Overexpression of GmNAC039 or GmNAC018 promotes nodule senescence in soybean. A and B) Comparison of growth phenotypes at 4 wpi of control soybean plants transformed with empty vector and plants overexpressing 3× Flag-tagged GmNAC039 or GmNAC018 (NAC039-OE or NAC018-OE). Scale bars = 5 cm. C and D) Nodule phenotypes of soybean plants harboring the empty vector (control) or overexpressing 3× Flag-tagged GmNAC039 or GmNAC018 (NAC039-OE or NAC018-OE). In each row, the two images at left show transgenic roots harboring the empty vector (Control) or overexpressing GmNAC039 or GmNAC018 (NAC039-OE or NAC018-OE) as seen under white light (first image) or fluorescent light (second image; green fluorescent protein (GFP) fluorescence). The third panels illustrate the size and color of nodules from one transgenic seedling. GFP served as a positive marker for transformed lines. Scale bars = 1.5 mm. E and F) Cell morphology and organization of nodules from transgenic hairy root plants of NAC039-OE (E) or NAC018-OE (F). The left panel illustrates the internal color of nodules from transgenic root, scale bars = 0.3 mm. The right panel represents longitudinal sections of nodules stained with toluidine blue dye. Scale bars = 100 μm. G and H) Nitrogenase activity of control and NAC039-OE (G) or NAC018-OE (H) nodules determined using an acetylene reduction assay. ARA, acetylene reduction activity. I and J) Nodule number of control, NAC039-OE (I), or NAC018-OE (J). Data shown in bar charts are mean ± SD. K and L) Relative expression of LbA and LbC1 in nodules from NAC039-OE (K), or NAC018-OE (L) from 3 transgenic roots per genotype, determined by qPCR. GmACT11 was used as the reference. Data shown in bar charts are means ± SD. Significance analyses were performed using GraphPad Prism version 9 based on paired Student's t-tests compared with the control (*P ≤ 0.05; **P ≤ 0.01; ***P ≤ 0.001; ****P ≤ 0.0001).

