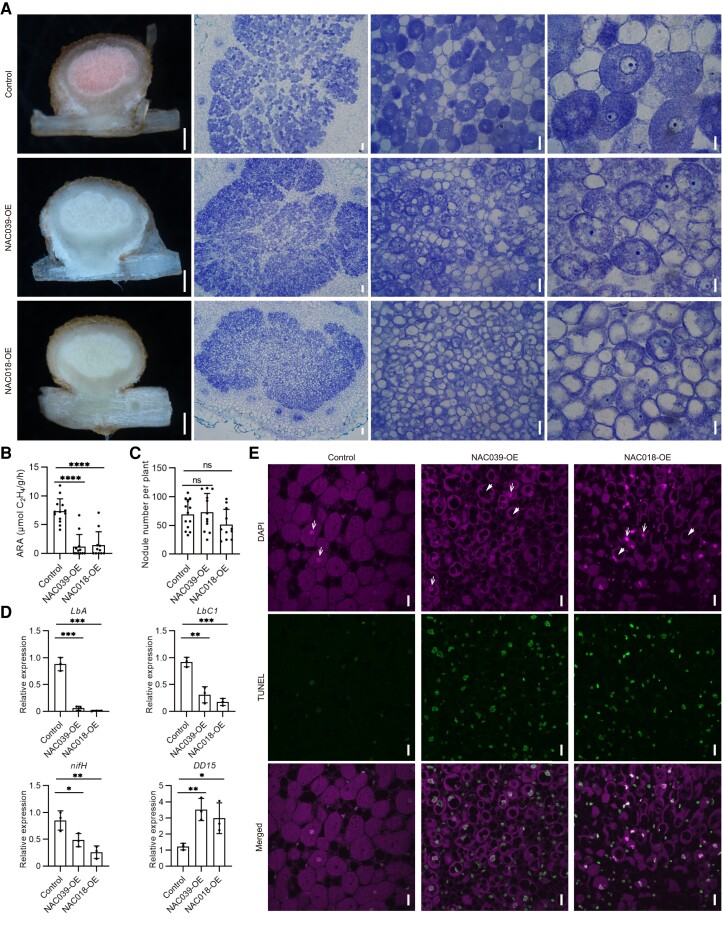
Figure 3.
Cell structures of GmNAC039-OE/GmNAC018-OE transgenic nodules. A) Toluidine blue-stained transverse sections of transgenic nodules at 2 wpi. From left to right, scale bar = 0.5 mm, 50 μm, 25 μm, and 10 μm. B and C) Nitrogenase activity determined by acetylene reduction activity (ARA) (B) and nodule number (C) in transgenic roots at 2 wpi. D) RT-qPCR analyses of symbiotic genes and senescence-associated marker gene DD15 in transgenic nodules at 2 wpi. Data shown in bar charts are means ± SD from 3 biological replicates. E) Apoptosis analysis in NAC039-OE and NAC018-OE nodules 4 wpi using a TUNEL assay. The upper panel (DAPI) illustrates DAPI-stained nuclei and rhizobia. The middle panel (TUNEL) represents double-strand DNA breaks labeled using the TUNEL assay. The lower panel (Merged) represents merged images of the DAPI and TUNEL signals. Nuclei and vacuoles are indicated by white arrows and arrowheads, respectively. Scale bar = 20 μm. Significance analyses were performed using GraphPad Prism version 9 based on paired Student's t-tests compared with the control (*P ≤ 0.05; **P ≤ 0.01; ***P ≤ 0.001; ****P ≤ 0.0001).

