Figure 5.
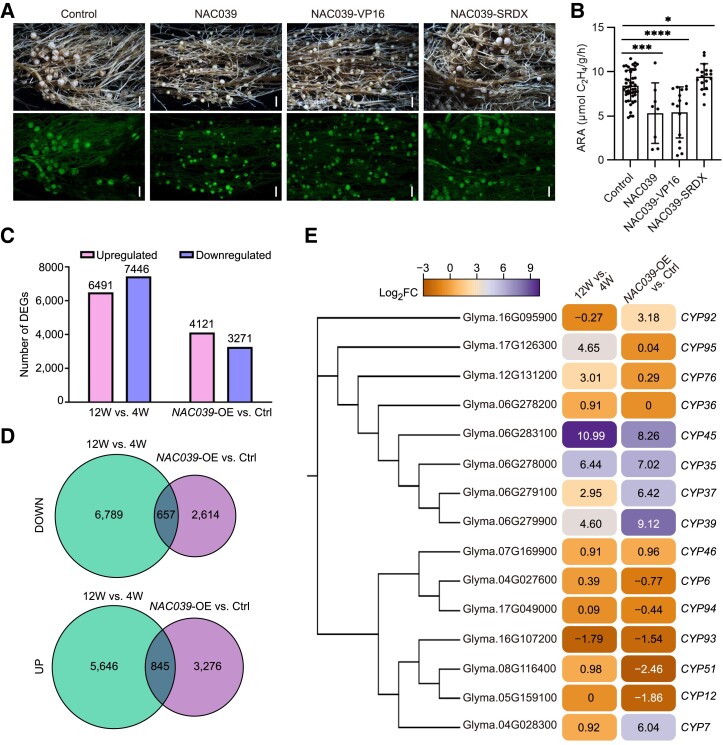
RNA-Seq analysis of gene expression patterns in NAC039-overexpression and naturally senescent nodules. A) Nodule phenotypes at 4 wpi of plants transformed with empty vector (Control), GmNAC039, GmNAC039-VP16, or GmNAC039-SRDX. Scale bars = 1.5 mm. B) Nitrogenase activity of nodules at 4 wpi. Asterisks show significant differences compared with the control determined by unpaired Student's t-test using GraphPad Prism version 9 (*P ≤ 0.05; ***P ≤ 0.001; ****P ≤ 0.0001). C) Comparison of the numbers of upregulated and downregulated differentially expressed genes (DEGs) in nodules at 12W vs. 4W and of NAC039-OE vs. Ctrl detected by RNA-Seq. D) Venn diagrams showing unique and common genes from different pairwise comparisons among DEG data sets. The 12W vs. 4W data set is shown in green, and the NAC039-OE vs. Ctrl. data set is shown in blue. E) Phylogenetic analysis and heatmap showing cysteine protease genes (CYPs) differentially expressed in naturally senescent nodules (12W vs. 4W) and NAC039-OE nodules (NAC039-OE vs. Ctrl). Significant DEGs had fold changes ≥ ± 1.5; P < 0.05. Number indicates the relative expression levels (log2 fold changes) of genes.

