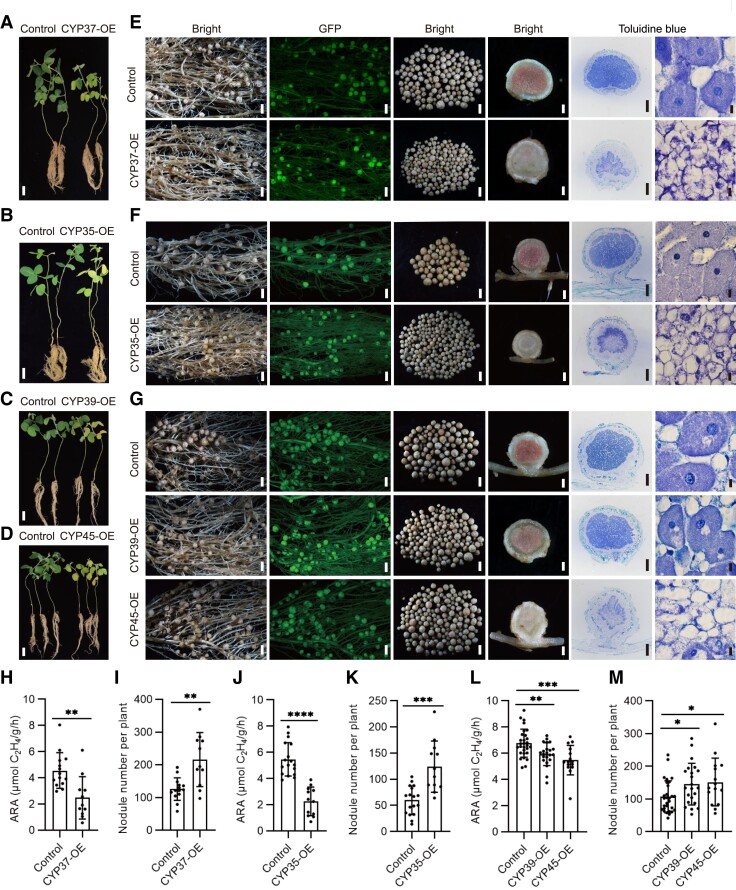
Figure 7.
The symbiotic phenotypes of plants overexpressing GmCYP37, GmCYP35, GmCYP39, or GmCYP45. A–D) Phenotypes of plants transformed with the empty vector (control), GmCYP37 (A), GmCYP35 (B), GmCYP39 (C), or GmCYP45 (D) at 4 wpi. Scale bars = 5 cm. E–G) Nodule phenotypes of transgenic roots at 4 wpi. GFP served as a positive marker for selection. The two left-most panels show nodulated transgenic roots under white light (first panel) and fluorescent light (second panel). The middle two panels show nodules picked from one transgenic root (third panel) and a longitudinal section of one of the nodules (fourth panel). The right-most two panels show nodule sections stained with toluidine blue dye and viewed at two different magnifications. The largest nodules at the base of the primary root were used for sections. Scale bars on the panels from left to right = 1.5 mm, 1.5 mm, 1.5 mm, 0.3 mm, 0.3, and 10 μm, respectively. H, J, and L) Nitrogenase activity of nodules at 4 wpi. I, K, and M) Nodule numbers of the overexpression hairy roots. Data are given as means ± SD. Significant differences were determined by unpaired Student's t-tests using GraphPad Prism version 9 (*P ≤ 0.05; **P ≤ 0.01; ***P ≤ 0.001; ****P ≤ 0.0001).

