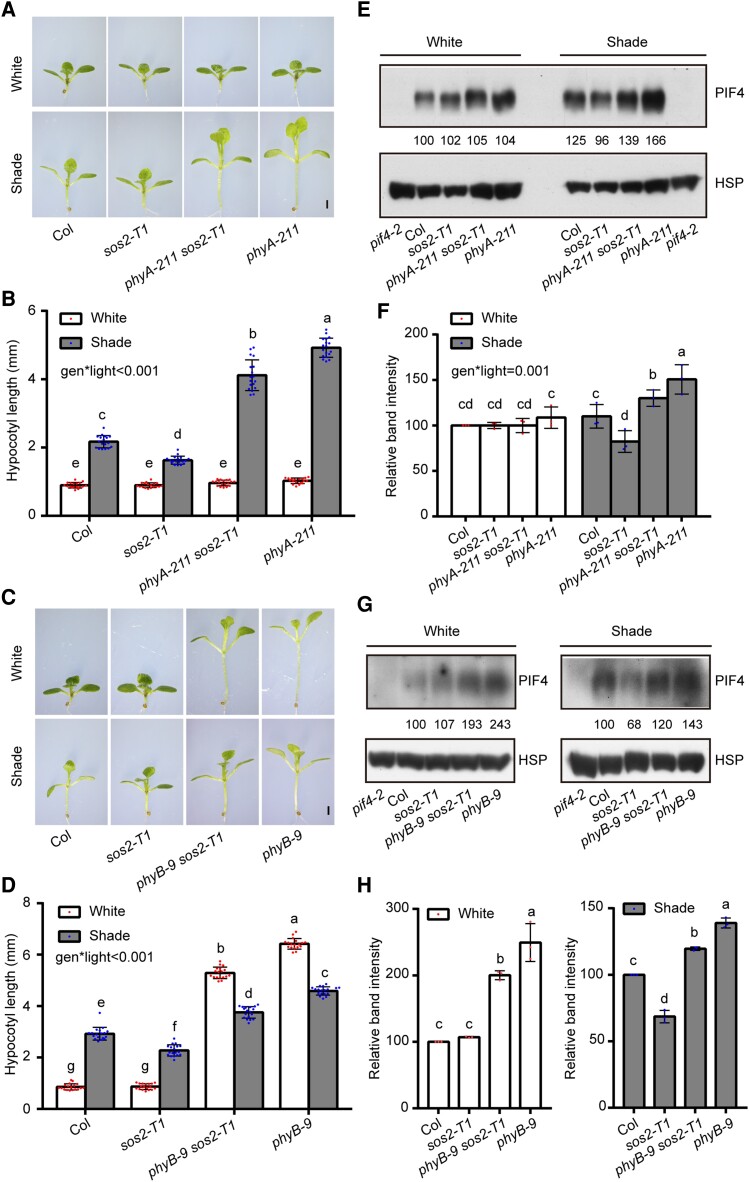
Figure 7.
SOS2 genetically interacts with phyA/phyB in mediating SAS. A and B) Phenotypes A) and hypocotyl lengths B) of Col, sos2-T1, phyA-211 sos2-T1, and phyA-211 seedlings first grown under simulated W light for 4 d and then transferred to simulated shade (R/FR, 0.4) or remained under simulated W light for 5 more days. In A), scale bar = 1 mm. In B), error bars represent Sd from 18 seedlings. Different letters represent significant differences by 2-way ANOVA with Tukey's post hoc test (P < 0.05; Supplemental Data Set 1). The interaction P value between genotypes and light conditions is shown inset (Supplemental Data Set 1). C and D) Phenotypes C) and hypocotyl lengths D) of Col, sos2-T1, phyB-9 sos2-T1, and phyB-9 seedlings first grown under simulated W light for 4 d and then transferred to simulated shade (R/FR, 0.8) or remained under simulated W light for 5 more days. In C), scale bar = 1 mm. In D), error bars represent Sd from 18 seedlings. Different letters represent significant differences by 2-way ANOVA with Tukey's post hoc test (P < 0.05; Supplemental Data Set 1). The interaction P value between genotypes and light conditions is shown inset (Supplemental Data Set 1). E and F) Immunoblots showing the levels of PIF4 proteins in Col, sos2-T1, phyA-211 sos2-T1, and phyA-211 seedlings first grown under simulated W light for 4 d and then transferred to simulated shade (R/FR, 0.4) or remained under simulated W light for 5 more days. Anti-HSP was used as sample loading control. Representative pictures are shown in E), and the relative levels of PIF4 proteins are shown in F). The interaction P value between genotypes and light conditions is shown inset (Supplemental Data Set 1). G and H) Immunoblots showing the levels of PIF4 proteins in Col, sos2-T1, phyB-9 sos2-T1, and phyB-9 seedlings first grown under simulated W light for 4 d and then transferred to simulated shade (R/FR, 0.8) or remained under simulated W light for 5 more days. Anti-HSP was used as sample loading control. Representative pictures are shown in G), and the relative levels of PIF4 proteins are shown in H). In E) and G), numbers below the immunoblots indicate the relative band intensities of PIF4 normalized to the loading control. The ratio of the first clear band was set to 100. Error bars in F) and H) represent Sd from 3 independent assays using 3 pools of seedlings. Different letters represent significant differences by 2-way F) and 1-way ANOVA H) with Duncan's post hoc test (P < 0.05; Supplemental Data Set 1).

