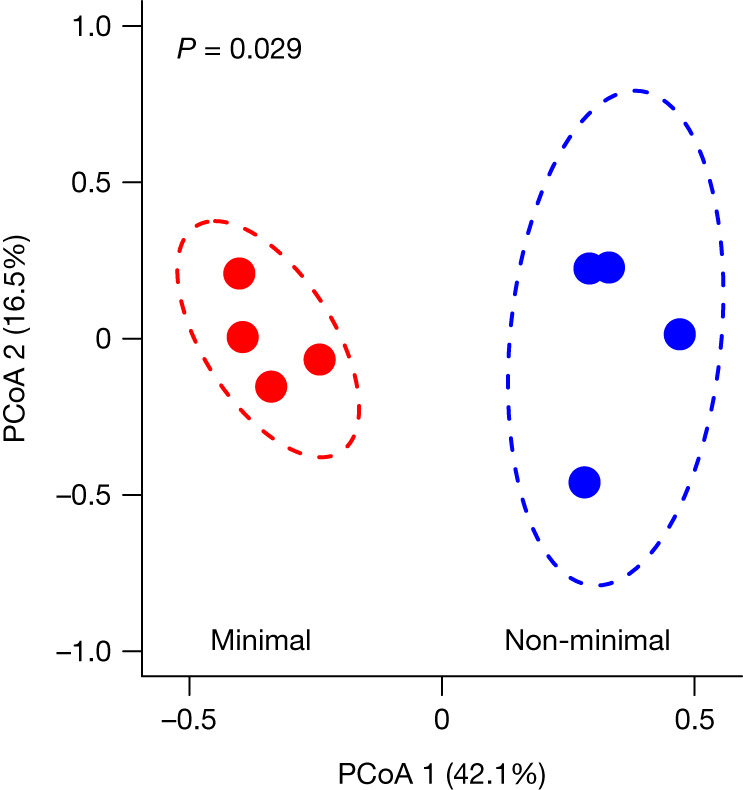
Fig. 3. The non-minimal cell and minimal cell populations acquired adaptive mutations in different sets of shared genes.

Ordination from a principal coordinates analysis (PCoA) created by a gene-by-population matrix using the Bray–Curtis distance metric after 2,000 generations of evolution (Extended Data Tables 2–4). The dashed lines represent 95% confidence ellipses around replicate populations (n = 4 for each cell type) represented by dark coloured symbols.
