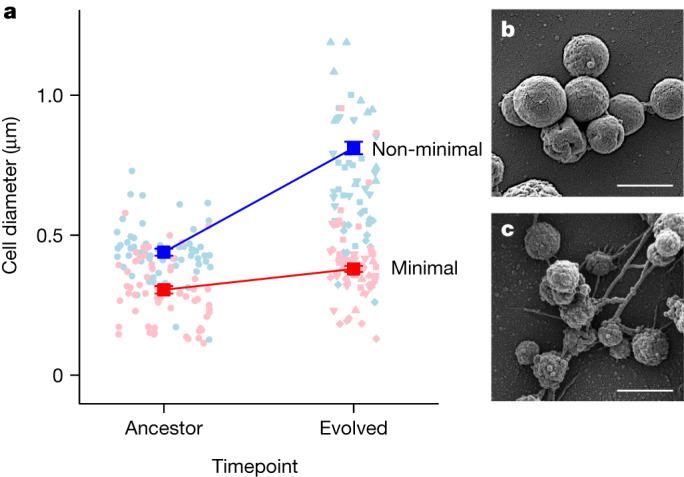
Fig. 4. The effect of genome minimization on the evolution of cell size.

a, Genome minimization was accompanied by a 31% decrease in cell size. Over 2,000 generations of evolution, the size of the non-minimal cells increased by 85% (P = 0.005), whereas the size of the minimal cells remained the same (P = 0.181). Owing to variation associated with replicate evolved populations, there was a marginal effect when directly comparing changes in the size of the minimal and non-minimal cells (P = 0.077; Supplementary Fig. 4). The dark coloured symbols represent the mean ± s.e.m. As the experiment was initiated with a single clone, error bars for the ancestral timepoint were calculated from samples of individuals (n = 62 and n = 75 for the non-minimal and minimal cell, respectively), whereas error bars at the evolved time point were calculated from individuals (n = 285 and n = 181 for the non-minimal and minimal cell, respectively) across replicate populations (n = 4). The light coloured circles represent randomly drawn data (n = 60) corresponding to the diameter of individual cells from the ancestral populations. The light coloured triangles (pointing up and down), diamonds and squares represent randomly drawn data (n = 60) corresponding to the diameter of individual cells from the four replicate evolved populations. The solid red and blue lines are a visual aid connecting the mean values of the minimal and non-minimal populations, respectively. b,c, Scanning electron micrographs obtained from evolved replicate populations of the non-minimal (b) and minimal (c) cells. Scale bars, 1 μm.
