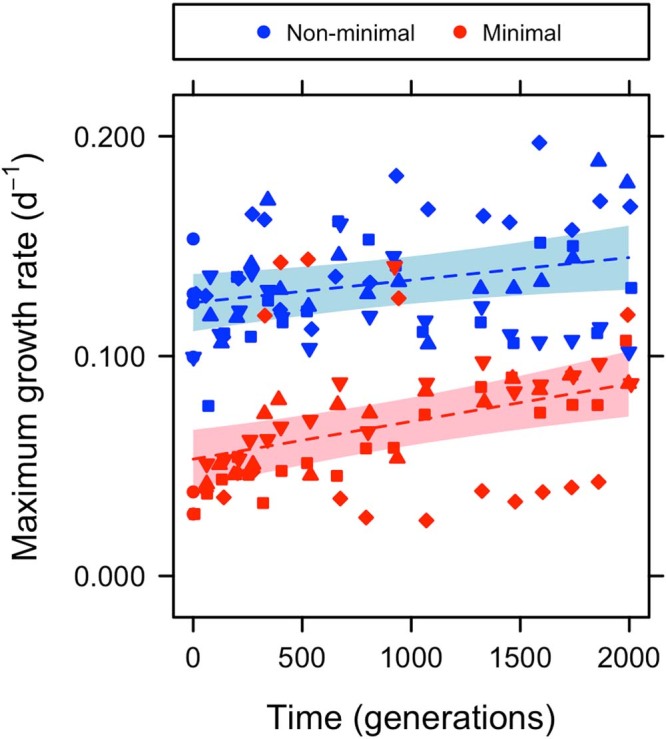
Extended Data Fig. 1. Trajectories of maximum growth rates (µmax) for the minimal cell and non-minimal cell.

Data (n = 141) were generated from growth-curve assays that were fit using a modified Gompertz equation (see Fig. S5) across 2000 generations of experimental evolution. With these estimates of µmax, we then fit a generalized linear mixed model (GLMM) where time (generation) and cell type (minimal cell vs. non-minimal cell) were treated as fixed effects and replicate evolved populations (n = 8) was treated as a random effect. Based on the intercepts from the GLMM, synthetic streamlining reduced µmax by 57% in the non-evolved ancestors. During subsequent evolution, µmax for both cell types increased at comparable rates over the course of the experiment (see Extended Data Table 1). In the figure, dark-coloured circles represent data from the ancestral populations, while triangles (up- and down-pointing), diamonds, and squares represent data from the replicate evolved populations. Dashed lines and light-coloured regions represent predicted values and 95% confidence intervals, respectively, for the fixed effects (generation and cell type). The conditional R2, which accounts for variance explained by the fixed and random effects, was 0.68. The variance partition coefficient (VPC) of 0.127 indicates that an appreciable portion of the total explained variance in µmax was associated with the random effect of the replicate evolved populations (See Extended Data Table 1). Additional information, including model fits, parameters, summary statistics, and residual plots, can be found in the online Figshare repository.
