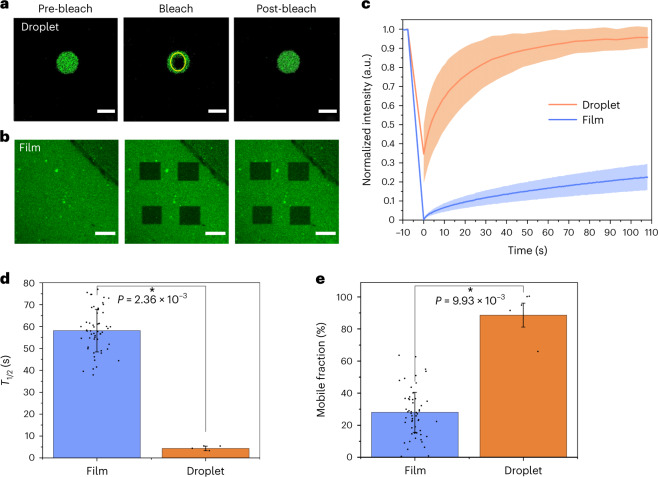
Fig. 2. FRAP experiments reveal the liquid-like structure of FUS LC droplets formed in bulk and the solid-like structure of the FUS LC film formed at the air/PBS buffer interface.
a,b, Pre-bleach, bleach and post-bleach fluorescence images for the FUS LC droplet (a) and FUS LC film (b). Scale bars, 5 μm (a), 20 μm (b). c, Fluorescence intensity versus time from N = 5 curves for droplets and N = 56 curves for films. The dark lines show the means, and the shaded regions are standard deviations. d,e, Half-time T1/2 of the fluorescence recovery (obtained from an exponential fit to the traces) (d) and mobile fraction values obtained for the FUS LC droplets and film (e). Bars represent the means, and error bars are standard deviations. Asterisks indicate statistical significance: P < 0.05 via Student’s t-test.

