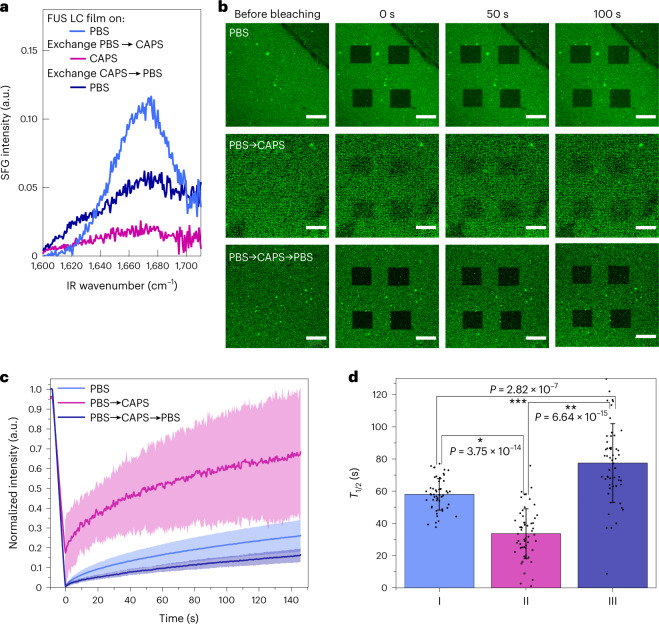
Fig. 4. Robustness of the FUS LC film against buffer exchange.
a, SFG spectra acquired in the amide I region for 1.5 μM FUS LC in PBS (blue), after PBS buffer exchange to CAPS pH 11 (purple) and after subsequent buffer exchange of CAPS back to PBS (dark blue). b–d, FRAP experiments for the 5% Cy3‐labelled 5 μM FUS LC domain and quantitative analysis. b, Representative FRAP images for buffer-exchange experiments. Note the consistent inability to completely bleach the CAPS-exchanged sample, implying high mobility. Scale bars, 20 μm. c, Normalized FRAP recovery of the film after formation in PBS buffer (blue), after buffer exchange to CAPS buffer (purple) and after further buffer exchange back to PBS buffer (dark blue). Each data line in c was averaged over N = 56 unique curves (four samples were prepared and, for each sample, four FRAP measurements were conducted with four bleaching regions of interest). The dark lines show the mean, and the shaded regions are standard deviations. d, Bar graphs showing the averaged time of fluorescence recovery time constant T1/2, inferred from the data in c. Bars show the mean, and the error bars are standard deviations. Asterisks show statistical significance, P < 0.05, using a two-way analysis of variance followed by a Student’s t-test between different groups. I, II and III denote the three experimental stages: PBS, PBS → CAPS and PBS → CAPS → PBS, respectively.

