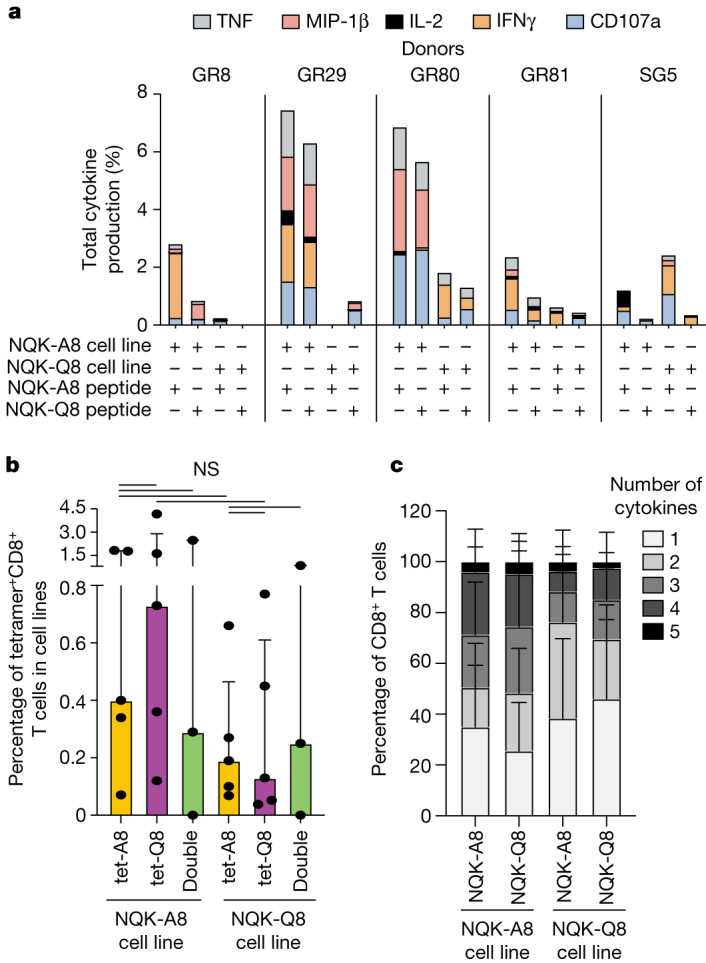
Fig. 2. NQK-specific T cells are cross-reactive.

a, Total cytokine production by CD8+ T cells in NQK-A8- and NQK-Q8-specific T cell lines. Each peptide-specific T cell line was restimulated individually with its cognate peptide or the homologous peptide as indicated, and the cytokine response was measured by intracellular cytokine staining (n = 5 donors). Percentages of effector functions (IFNγ, TNF, IL-2, MIP-1β, CD107a) minus the no peptide control are reported. b, In vitro tetramer analysis for the NQK-Q8- and NQK-A8-specific T cell lines (n = 5 donors). The cell lines were tetramer stained with a single tet-A8 (orange bar) or tet-Q8 (purple bar) tetramer or both tetramers (green bar). The frequency of tetramer+CD8+ T cells is shown. Data are median ± interquartile range. Differences between two groups were compared using two-tailed unpaired t-tests. P < 0.05 was considered to be significant. NS, not significant. c, Polyfunctionality analysis of CD8+ NQK-peptide-specific T cells from five unexposed donors. The number of functions is shown on a scale from 5 (black) to 1 (white). Data are the relative frequency (%) of total cytokine+CD8+ T cells. Data are mean ± s.e.m. Differences between two groups were determined using two-tailed unpaired t-tests. P < 0.05 was considered to be significant, and the result was not significant.
