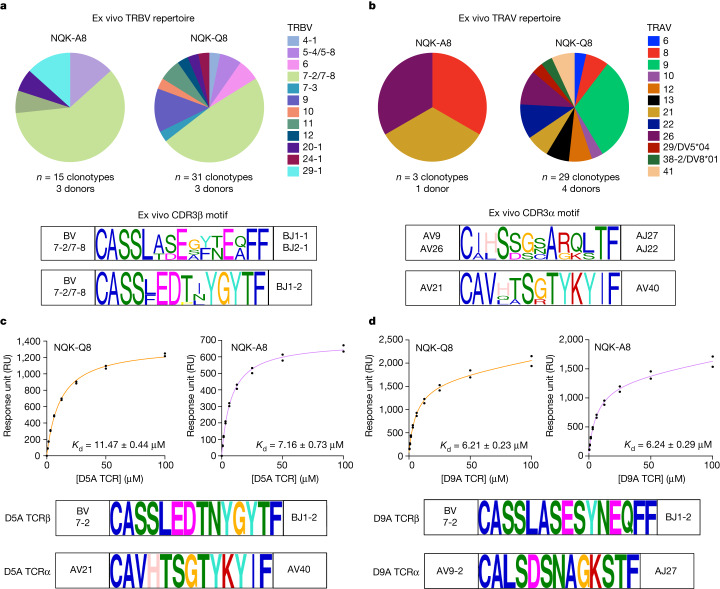
Fig. 3. NQK-specific T cells are characterized by the presence of high-affinity public TCRs in unexposed donors.
a,b, Analysis of the ex vivo TCR repertoire for NQK-A8- and NQK-Q8-specific T cells after TAME on the basis of TRBV (a) and TRAV (b) use. The pie charts show the percentage of each TRBV or TRAV used in the single-cell sorted clonotypes. The CDR3β and CDR3α sequence motifs are shown below the pie charts, respectively, for the TCRs with the biased expression of TRBV7-2/7-8 paired with TRAV9/26 or TRAV21, including the public TCRs. c,d, The binding response (response units (RU)) of D5A (c) and D9A (d) TCRs (analyte) against HLA-B*15:01–NQK complexes (A8 in orange and Q8 in purple). The public TCR D5A expresses TRBV7-2 paired with TRAV21, and the public D9A TCR expresses TRBV7-2 paired with TRAV9-2; the CDR3β and CDR3α sequences for each public TCRs are shown below the binding curves. The SPR steady-state binding curves represent binding under a TCR concentration range of 0.39–100 μM. n = 2 biologically independent experiments performed in duplicate; the graph shows the results from one experiment performed in duplicate, represented by the black dots.

