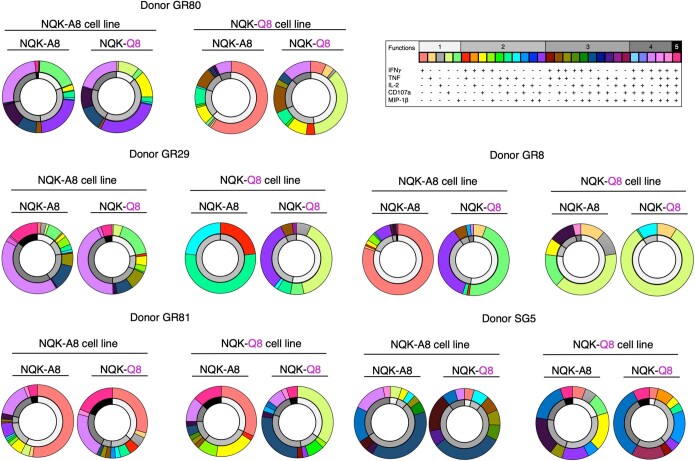
Extended Data Fig. 3. Functionality pie charts of T cell lines.
Frequency of CD8+ T cells with different effector functions (IFNγ, TNF, IL-2, MIP-1β, CD107a) was determined, along with the number of different functions, minus the no peptide control. The outer ring of the double ring pie shows the function profile in different colours according to the table, and the inner ring represents the number of functions with black for 5 and white for 1.

