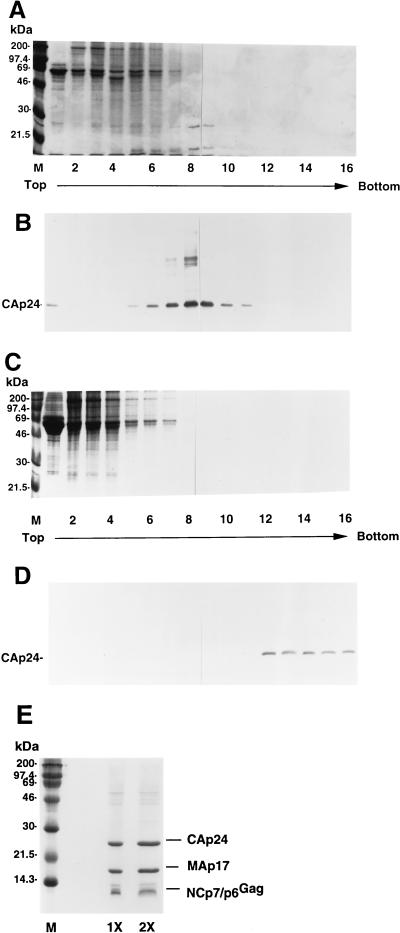
FIG. 3.
Comparison of sedimentation patterns of extracellular nonviral and viral proteins by sucrose density-equilibrium gradient or OptiPrep gradient analysis. Culture supernatants from HXB2NEO H9 cells were first concentrated by being pelleted through a 20% sucrose cushion and then subjected to a 20 to 60% sucrose density-equilibrium gradient centrifugation (A and B) or a 6 to 18% iodixanol velocity gradient centrifugation (C and D). Fractions were collected, with fraction 1 referring to the top of the gradient, as indicated; the protein profiles were analyzed by Coomassie blue staining (A and C) or immunoblotting with an HIV-1-positive serum (B and D). (E) Proteins from fraction 13 of the OptiPrep velocity gradient were separated by SDS-PAGE and stained with Coomassie blue. Lanes 1X and 2X represent 2.5 μg and 5.0 μg of CAp24 viral equivalents, respectively.

