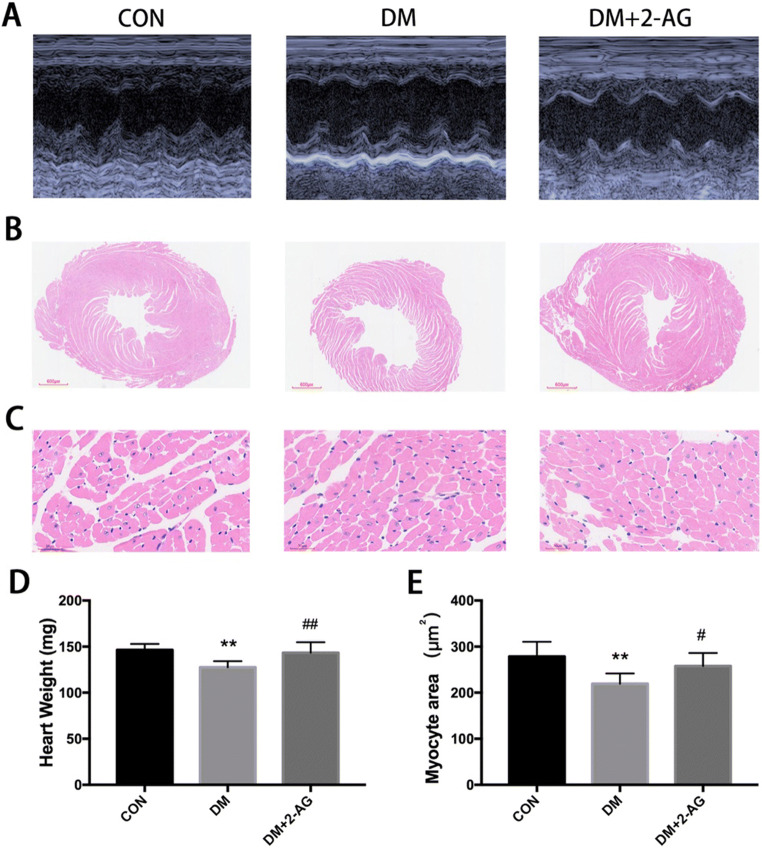
Fig. 2.
2-AG improves cardiac function and ventricular remodeling in diabetic mice A. Representative images of M-type echocardiograms. B. Overall view of H&E staining. Scale bar, 600 μm. C. Representative diagram of H&E staining cross section of the heart. Scale bar, 30 μm. D. Heart weight. E. Statistical graph of myocardial cross-sectional area. **P < 0.01, ***P < 0.001, compared with the CON group; #P < 0.05, ##P < 0.01, compared with the DM group. n = 7

