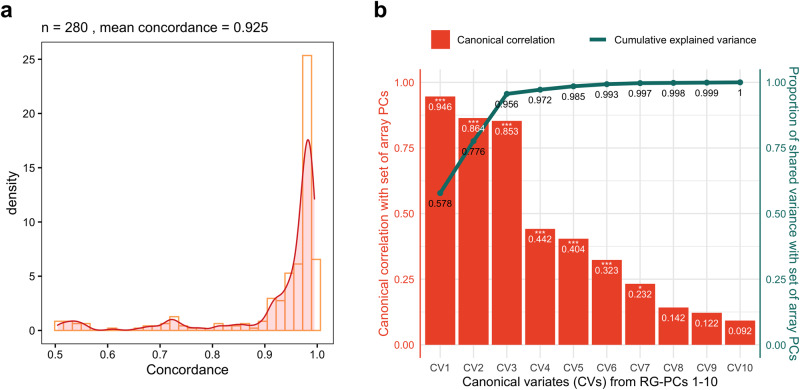
Fig. 2. RGStraP was able to capture population structure in the Nepal cohort comparable to paired array genotype.
a Genotype concordance of common SNPs between array and RNAseq samples was found to be high, with most samples (232 out of 280) reaching >0.90 concordances. b Canonical correlation analysis between ten RG-PCs and ten array PCs showed significant (Wilks’ Lambda, p-value < 0.05) correlations for the first 7 canonical variates (CVs) between the two sets. The first 3 CVs from 10 RG-PCs strongly captured the genetic information from array PCs (Rc1 = 0.946, Rc2 = 0.864, Rc3 = 0.853), in which the cumulative proportion of shared variance between the two sets reached up to 0.956 from just the 3 CVs.

