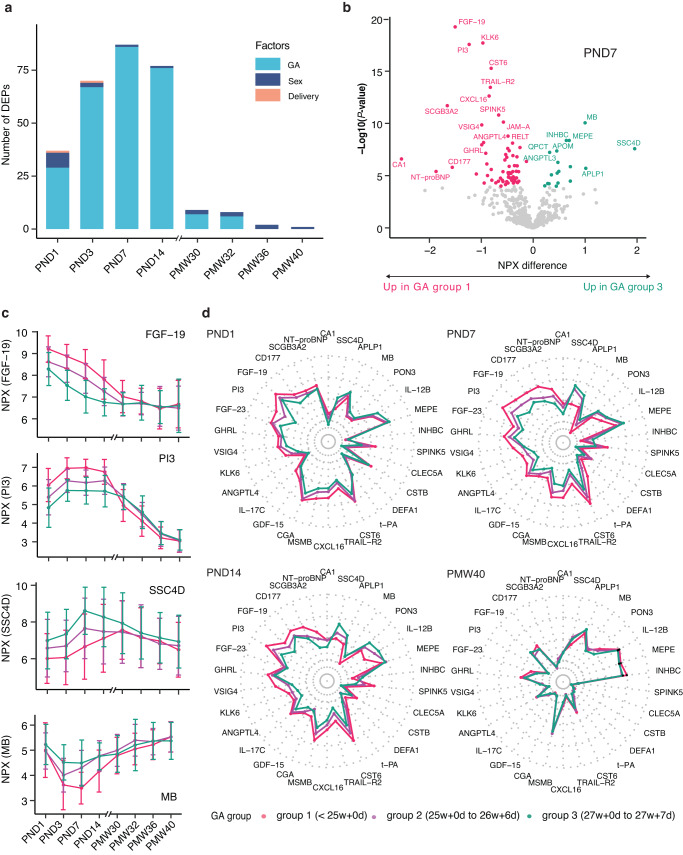
Fig. 6. Gestational age (GA) impact on blood protein expressions after preterm birth.
a Bar-plot representing the numbers of differentially expressed proteins related to GA, sex, and delivery mode. b Volcano plot showing the identified differentially expressed proteins (n = 86) across different GA groups on postnatal day 7. The x-axis represents log2 fold-change (FC) in GA group 3 compared to GA group 1. The y-axis represents −log10 adjusted P-values. Differentially expressed proteins were defined as proteins with adjusted P-values < 0.01 (three-way balanced ANOVA for GA with sex and delivery mode as covariates). Multiple test corrections have been applied to the P-values using the Benjamini and Hochberg method. c Four examples of up- and down-regulated proteins across three GA groups, error bars represent mean ± SD, color-coded by GA groups. GA group 1 (red), born at less than 25 + 0 (weeks + days) (N = 61); GA group 2 (purple), born at 25 + 0 to 26 + 6 (weeks + days) (N = 81); and GA group 3 (green), born at 27 + 0 to 27 + 6 (weeks + days) of gestation (N = 40). d Radar plots showing median levels of top 30 differentially expressed proteins across three GA groups at PND1, PND7, PND14, and PMW40.

