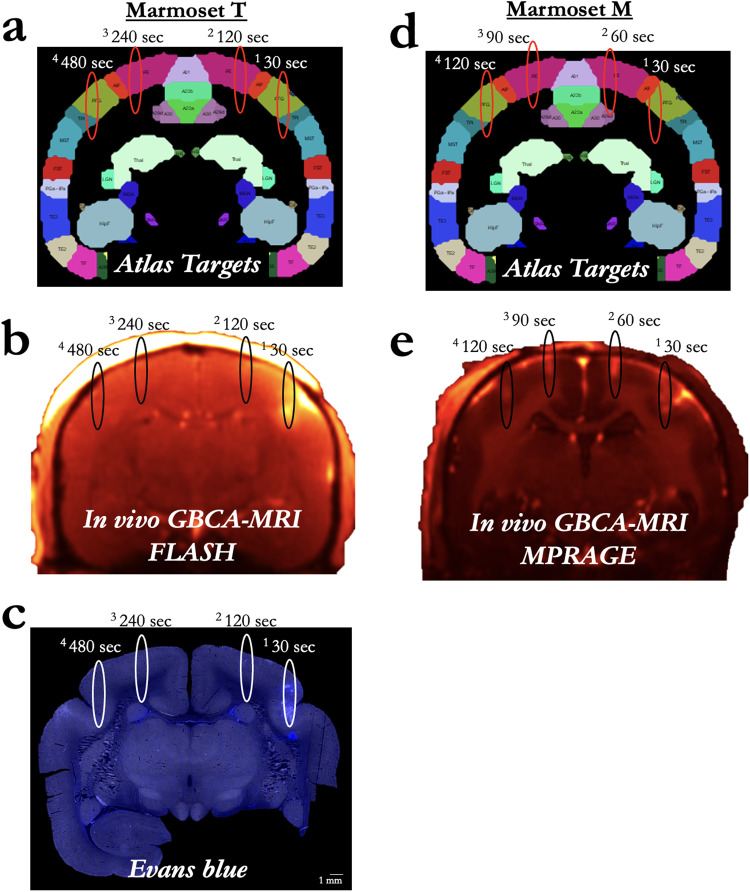
Fig. 4. Microbubble clearance.
a Sonication target locations for Marmoset T at 30–480 s after a single bolus injection of 200 µl/kg of microbubbles. b GBCA contrast enhancement due to successful BBB disruption in Marmoset T. c Sites in Marmoset T as reported by Evans blue staining. d Sonication target locations for Marmoset M, but at 30–120 s after a single bolus injection of microbubbles at 200 µl/kg. e Same as (b), for Marmoset M. Note: the MRI sequence varied for Marmosets T and M due to Marmoset M participating in other experiments, but both clearly showed T1-weighted GBCA contrast. No Evans blue was injected in Marmoset M.

