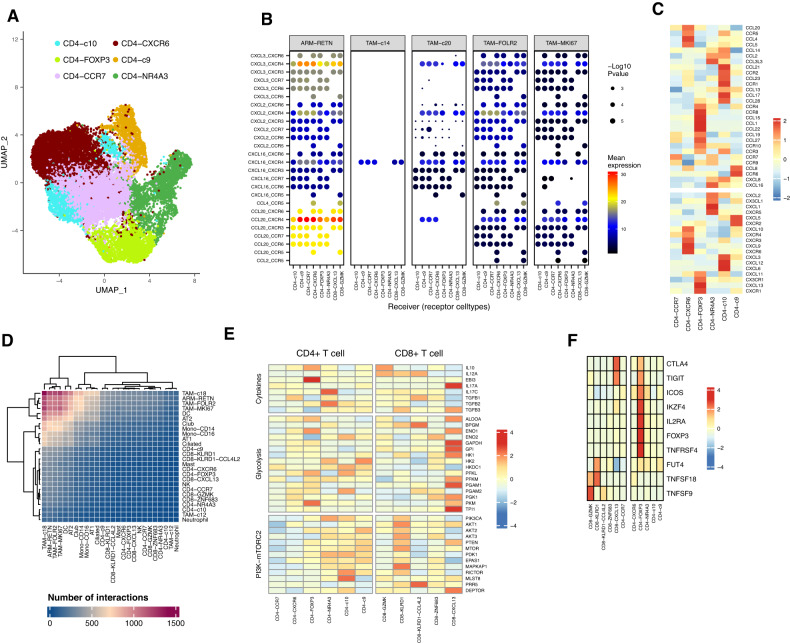
Fig. 6. CD4+NR4A3 may be recruited by TAM-FOLR2 collaborating with DCs and converted to Treg.
A UMAP of single-cell transcriptomes of CD4+ T cell subclusters. B An interaction map of selected chemokine ligands and receptors between CD4+ T cell subtypes and macrophage subtypes. p-values (two-tailed permutation test) are indicated by circle size; the scale is on the right. The means of the average level of two interacting molecules are indicated by color. C Heatmap of relative expression values of chemokine ligand/receptor transcriptomes in CD4+ T cell subtypes. D Heatmap depicting the interactions among different cell subtypes. E Heatmap of Treg targeted genes (involved in cytokines, glycolysis related, and PI3K-mTORC2 pathways) expression in CD4+ and CD8+ T cell subtypes. F Heatmap of NR4A3 target gene expression in CD8+ and CD4+ T cell subtypes.

