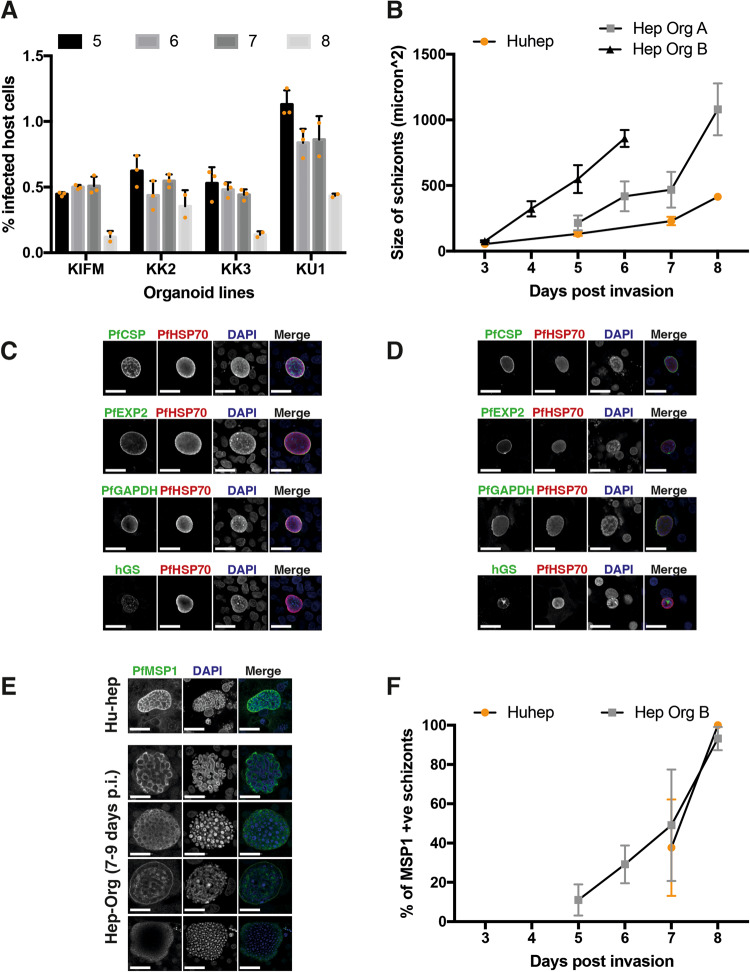
Fig. 1. P. falciparum NF175 infection and development in HepOrgs.
A Percentage of host cells (HepOrgs) with NF175 schizonts. Each bar represents the average of triplicates while only duplicates are shown for day 8. (n = 4 donors; KIFM, KK2, KK3 and KU1; error bar is the mean ± SD of three technical replicates). B The size of NF175 schizonts in HepOrg experiment A and B compared to HuHeps. Each point represents the average of median of >100 schizonts from three biological replicates with standard deviation. For the HepOrg A, each point represents the average of median of KK2, KIFM, KU1 where >25 schizonts are measured for each line at each time point. For HepOrg B, each point represents the average of median of KIFM, KK2, KK3 and KU1 where > 100 schizonts are measured for each line at each time point. Areas under the schizont growth curves of Huheps and respectively HepOrg A (p = 0.001; n = 4 donors) and HepOrg B (p = 0.0002; n = 4 donors) were significantly different (Welch t-test, two-sided). C Confocal images of HepOrgs and D HuHeps at day 5 p.i. showing the expression of typical liver-stage markers; from top to bottom: Circumsporozoite protein (CSP), Exported Protein 2 (EXP2), Glyceraldehyde-3-phosphate dehydrogenase (GAPDH) and human Glutamine Synthetase (hGS). Scale bar is 25 microns. E Confocal images of Merozoite Surface Protein 1 (PfMSP1) in schizonts of HuHeps (top) and HepOrgs (bottom) on day 7-9 p.i. Scale bar is 25 microns. For C, D and E, these stainings have been repeated in three independent experiments and here a representative image is shown for each staining combination. F Average percentage with standard deviation of PfMSP1 positive schizonts from HepOrg B (n = 4; KIFM, KK2, KK3, KU1) and HuHep (n = 3) assessed >100 schizonts per line per time point. See also Fig. S1.

