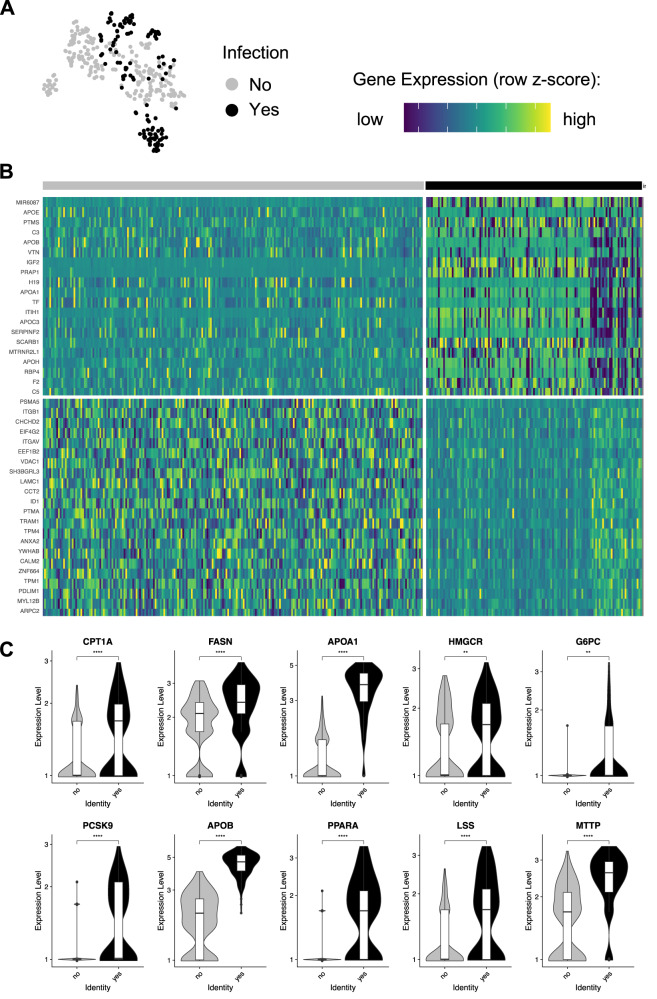
Fig. 3. Pf-infected hepatocytes display a distinct gene-expression pattern.
A t-SNE map of cells at day 5 p.i. showing the infection state (uninfected cells, n = 222; infected cells, n = 126). B Heatmap showing differentially expressed (DE) genes between infected and uninfected cells. C Violin plots showing a selection of DE genes between infected and uninfected cells. Two-sided Mann–Whitney U (Wilcoxon rank-sum) test: **p < 0.01, ***p < 0.001, ****p < 0.0001. CPT1A, p = 3.3−5; FASN, p = 5.8−10; APOA1, p > 2.22−16; HMGCR, p = 0.0062; G6PC, p = 0.0011; PCSK9, p = 2−10; APOB, p > 2.22−16; PPARA, p > 2.22−16; LSS, p = 1.3−7; MTTP, p > 2.22−16. Box plots in C indicate the median (Q2), 25th percentile (Q1) and 75th percentile (Q3) with the whiskers showing the minimum (Q1 – 1.5 × interquartile range) and maximum (Q3 + 1.5 × interquartile range). See also Supplementary Data 2 and 3. Source data are provided as a Source data file and Supplementary Data 5.

