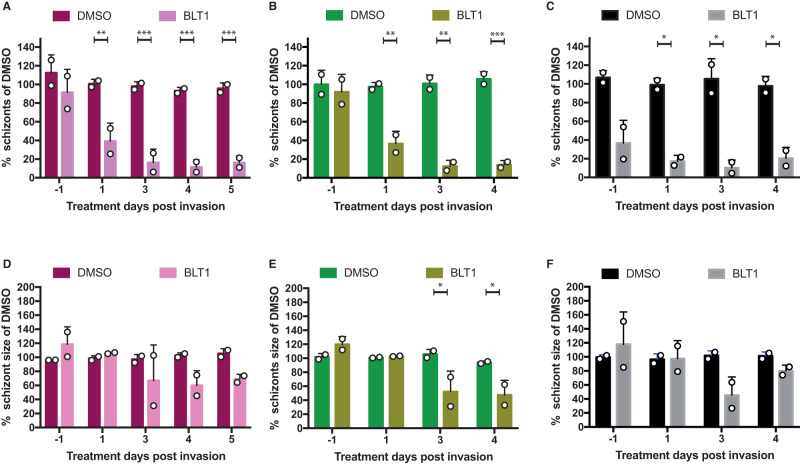
Fig. 5. Effect of BLT1-inhibitor on Pf-liver-stage development.
The average (of triplicates) number (A–C) and size (D–F) of schizonts in HuHeps infected with strain NF175 (Magenta) NF135 (Green) and NF54 (Black) and treated with either DMSO or BLT1. Each bar represents the average and error bars (SD) of three technical replicates (A–C) from two biological experiments (n = 2). For schizont size (D–F) data are shown of two technical replicates of at least 100 schizonts except for NF54 due to low numbers of schizonts surviving (D–F). Raw numbers for this panel are shown in Figs. S8 and S9. Sidak’s multiple comparison test (two sided) is used to compare DMSO and BLT1 conditions for A–F and annotated as *p < 0.05, **p < 0.01, ***p < 0.001. For A, p values from left to right are 0.0014, 0.0004, 0.0004, and 0.0005. For B, p values are 0.0032, 0.0010, 0.0009. For C, p values are 0.0369, 0.0216, 0.0447. For E, p values are 0.0182 and 0.0387.

