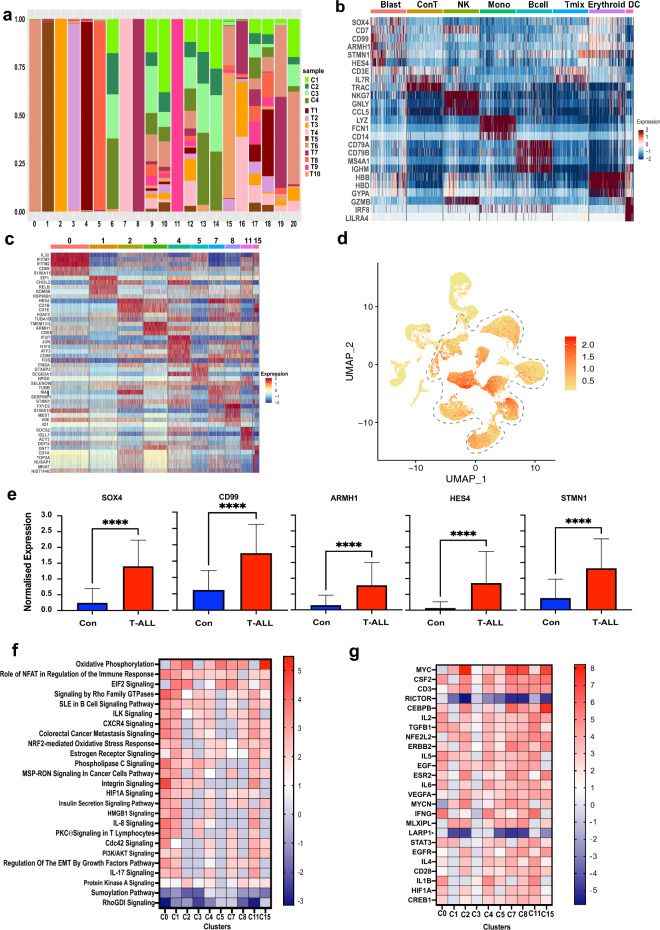
Figure 2.
Pediatric T-ALL bone marrow blast expression profiles. (a) Bar plot showing sample-wise percent composition of each cluster in the merged Dx T-ALL and control samples Seurat object as indicated by the legend. (b) Heatmap (downsampled randomly to 500 cells each cell type except DCs) showing scaled expression of canonical markers for different cell types across annotated clusters. Red and blue indicate upregulation and downregulation, respectively. (c) Heatmap showing scaled expression of select top cluster distinguishing genes in majority patient specific blast clusters with cluster numbers on the top. (d) Feature plot of the merged Dx T-ALL and control samples showing combined expression of genes SOX4, JUN, STMN1, CD99, TUBA1B. (e) Relative expression of the indicated markers in control BM samples (blue) vs pediatric T-ALL samples (red). The asterisk denotes significance (P < 0.0001). (f) Heatmap showing pathways commonly dysregulated in different T-ALL patient blast clusters using the IPA analysis tool (Qiagen). The color scale on the right represents the Z-score indicating the extent of upregulation (red) or downregulation (blue). (g) Upstream regulatory molecules significantly activated (red) or inhibited (blue), as denoted by the color scale (Z-score) to the right, in the different T-ALL patient blast clusters (x-axis).

