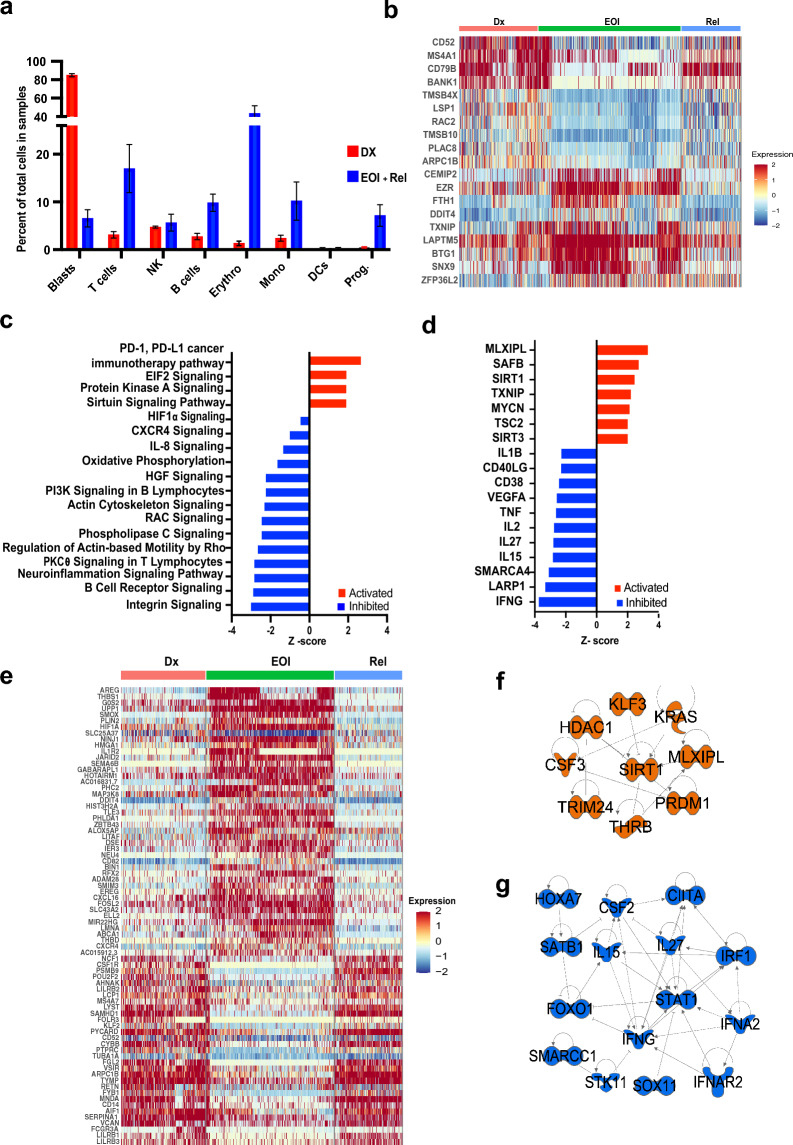
Figure 4.
Comparing T-ALL BM microenvironment at Dx and EOI. (a) Bar-plot showing relative percent of blasts, T cells, NK cells, B cells, Erythroid cells, Monocytes, Dendritic cells (DCs) and Progenitor cells (Prog.) at Dx (red) and EOI + Relapse (blue). (b, e) Heatmaps showing scaled expression of genes derived from differential gene expression analysis between matched Dx and EOI (b) B cells from cluster 7 or (e) monocytes from clusters 13 and 17. Although the Relapse sample was not included in the analyses, it is shown in the heat map for comparison. Red, green and blue bars on top denote Dx, EOI and Relapse cells, respectively. (c) and (d) Bar plots showing Z-scores of selected pathways and upstream regulators that are activated (red) or inhibited (blue) in B cells at EOI relative to Dx based on differential gene expression generated using the IPA tool. Z-scores of selected regulators that are upregulated (f) or downregulated (g) in EOI monocytes relative to matched Dx samples.

