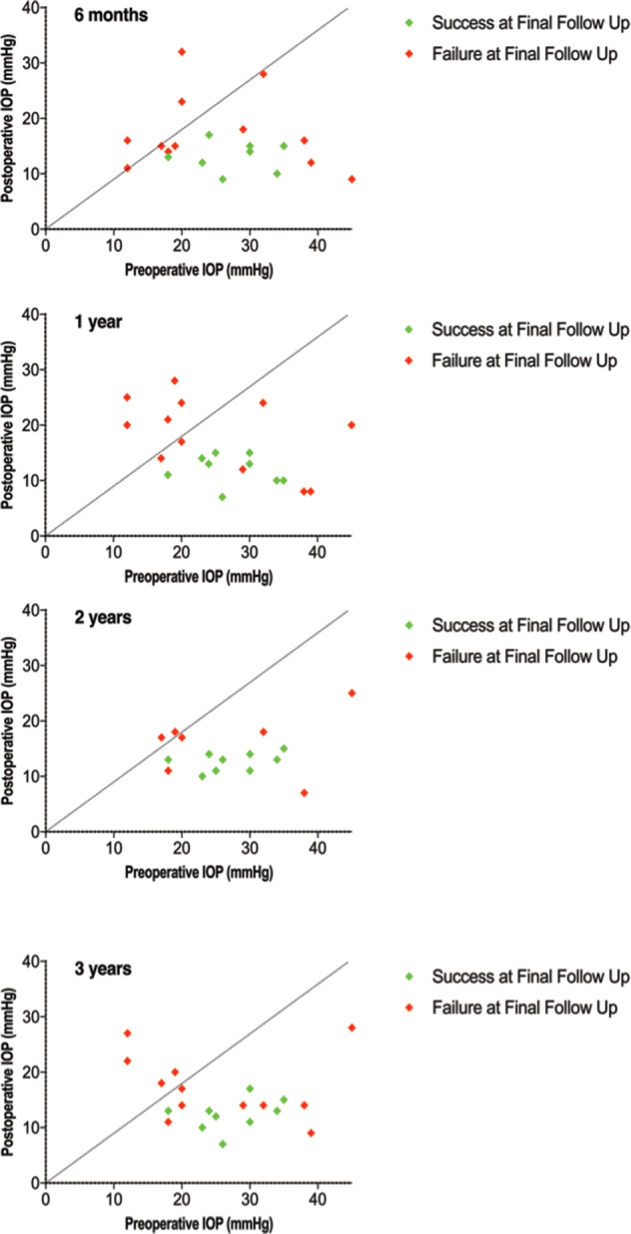
Fig. 4. Intraocular pressure over follow-up.

Scattergram of preoperative vs postoperative intraocular pressure at 6 months, 1 year, 2 year and 3 years after surgery. Each point represents one individual study eye. Eyes classified as success at final follow up are indicated by a green point with eyes classified as failure at final follow up are indicated by a red point. The dotted line represents equivalence; that is, points below the line show a reduction in IOP and points above show an increase.
