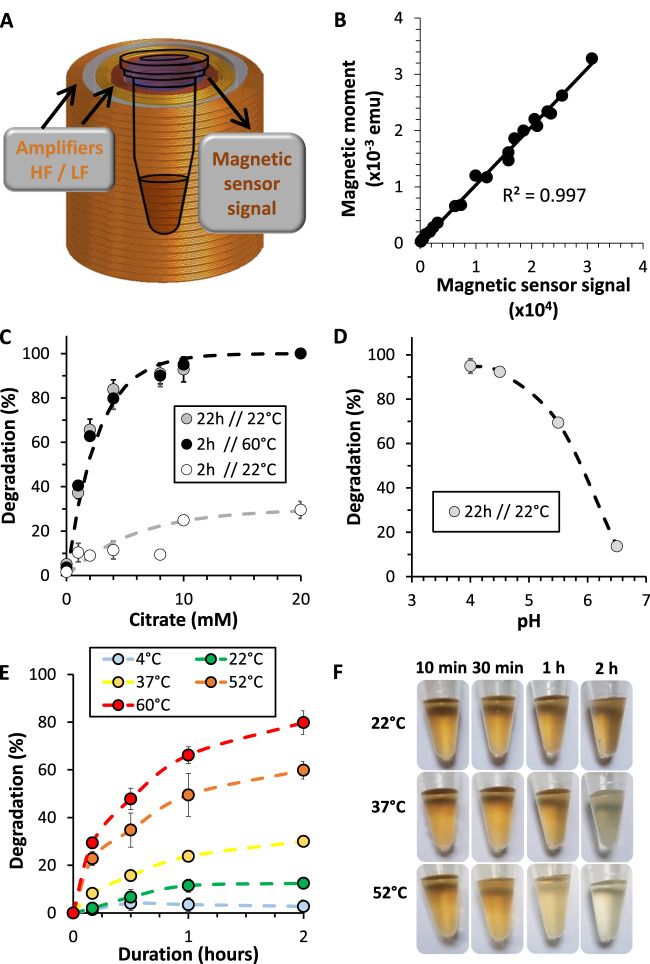
Fig. 1. Magnetism as a fingerprint of the nanoparticle degradation process in a lysosomal-like solution.
A Schematization of the magnetic sensor, made of two independent coils that generate a two-frequency magnetic field. HF high frequency, LF low frequency. B Correlation between the magnetic sensor signal and the magnetic moment obtained via VSM. C Degradation rate (%) in aqueous dispersion at pH = 4.5 with nanoparticles at [Fe] = 2 mM and with varying amounts of iron chelating agent at 22 °C and 60 °C (n ≥ 3). D Effect of pH on degradation for the [Fe] = 2 mM and [Citrate] = 4 mM condition (n ≥ 3). E Nanoparticle degradation rate in aqueous dispersion at pH = 4.5, [Fe] = 2 mM, and [Citrate] = 4 mM, subjected to increasing temperatures (n ≥ 3). F Panel of previous nanoparticle solutions showing a change in color density following degradation. n values represent the number of independent replicas, where data are presented as mean ± SD.

