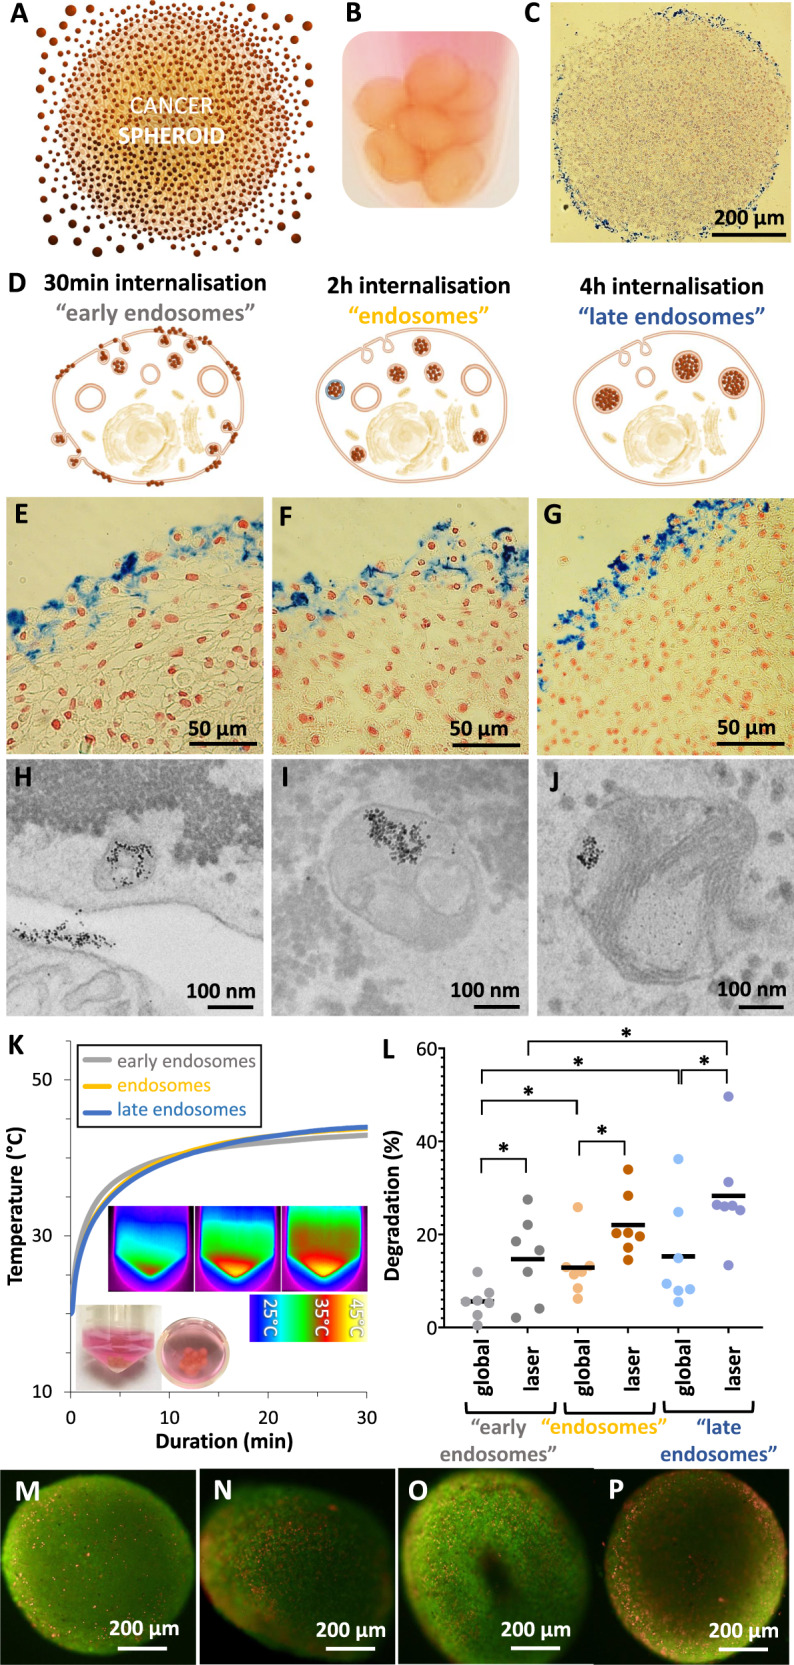
Fig. 3. Nanoparticle degradation in the intracellular environment of a tumor spheroid model.

A Schematization of nanoparticles interaction with the spheroids outer layer. B Image of spheroids after the initial incubation in a solution of nanoparticles with [Fe] = 2 mM and [Citrate] = 10 mM at 4 °C. C Prussian Blue showing iron in blue, evidencing the presence of nanoparticles at the spheroid periphery. D Schematization of nanoparticle uptake after incubation of the spheroids for 30 min (early endosomes), 2 h (endosomes) and 4 h (late endosomes) at 37 °C. E–G Prussian Blue staining of spheroids under the same conditions. Endosomal progression can be identified by a stronger, punctual blue signal within the cells. H–J TEM imaging for the same conditions, evidencing a similar progression of nanoparticle localization. K Spheroids heating profile for the three nanoparticles localization conditions after application of a laser power density of 2 W/cm2 for 30 min. Insets show corresponding thermal IR camera images. L Average nanoparticle degradation after 30 min heating at 42 °C depending on their intracellular location (n > 3). M–P Composite fluorescence image illustrating the cytotoxicity of the heating treatment in spheroids. Images show merging of live green and dead red for the early endosomes (M, N) and late endosomes (O, P) after global (M, O) or laser (N, P) heating. n values represent the number of independent replicas. Unpaired two-tailed Student’s t test was used to evaluate statistical significance, where *P < 0.05.
