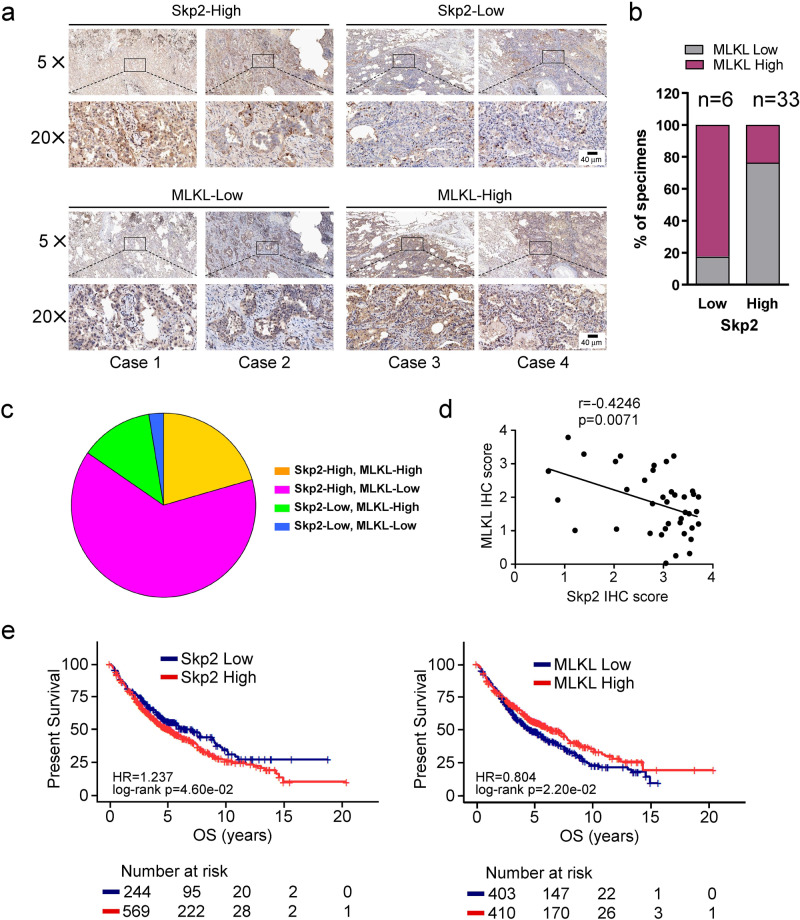
Fig. 2. Skp2 expression is inversely correlated with MLKL in NSCLC tissues.
a Representative cases from 39 NSCLC specimens were analyzed by IHC staining with Skp2 and MLKL. b The percentage of samples displaying low or high Skp2 expression compared to the expression levels of MLKL. N = 39. c The relative proportions of protein expressions were illustrated as a pie chart. d Scatterplot showed a negative correlation between Skp2 and MLKL. e Kaplan–Meier analysis showing correlation between Skp2 or MLKL expression levels and overall survival (OS) of patients (n = 813) with NSCLC. The gene expression data and survival information were downloaded from the Gene Expression Omnibus (GEO) database, including GSE29013, GSE37745, GSE31210, and GSE157011 datasets, based on GPL570 platform. The plots were draw by the R software. p < 0.05 by log-rank (Mantel–Cox) test was considered to be a statistically significant difference.

