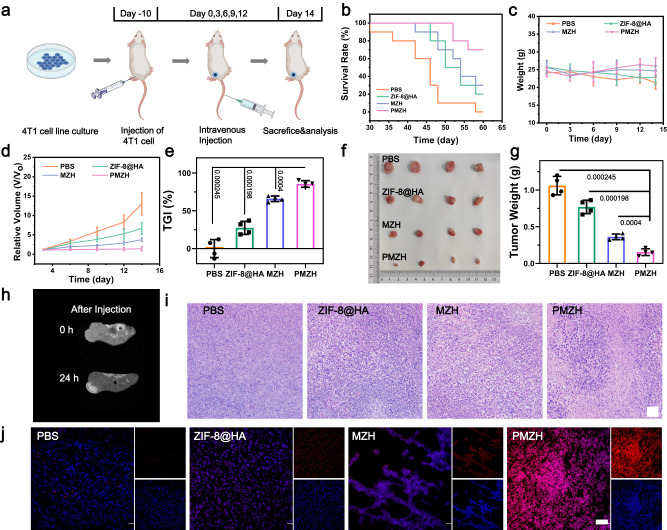
Fig. 6. Antitumor therapeutic effect of PMZH in vivo.
a Schematic representation of vaccination and treatment. b Survival rates (n = 10 mice per group), c Body weights, d tumor volume changes, e TGI rates, f photographs of dissected tumors, g tumor weights of mice after different treatments. h MRI images after PMZH injection in 24 h. Data were presented as mean ± SD (n = 4 mice) in c, d, e, g. P values were assessed using Student’s t test (two-tailed). i H&E staining pictures of tumors after corresponding treatments. j ROS evaluation in tumors after different treatments. n = 3 mice per group in h–j. Source data are provided as a Source Data file. (Scale bar = 50 µm in i and 100 µm in j.).

