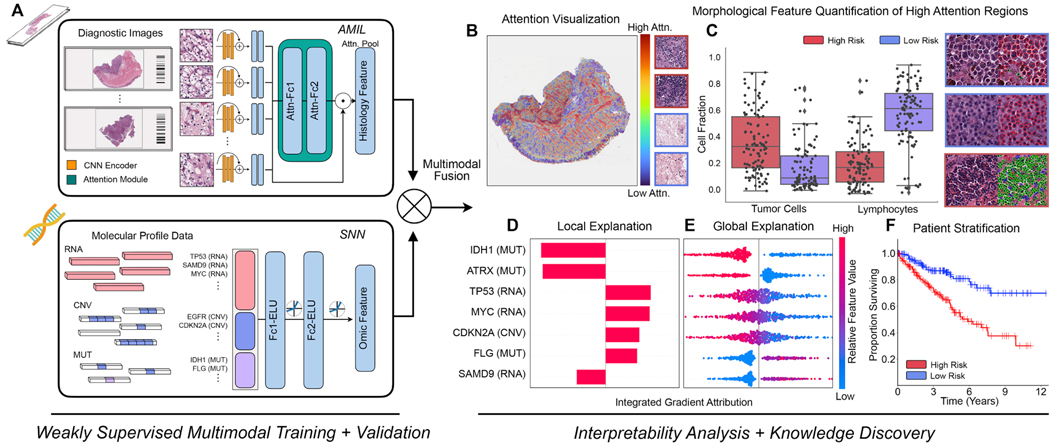
Figure 1: Pathology-Omic Research Platform for Integrative Survival Estimation (PORPOISE) Workflow.
A. Patient data in the form of digitized high-resolution FFPE H&E histology glass slides (known as WSIs) with corresponding molecular data are used as input in our algorithm. Our multimodal algorithm consists of three neural network modules together: 1) an attention-based multiple instance learning (AMIL) network for processing WSIs, 2) a self-normalizing network (SNN) for processing molecular data features, and 3) a multimodal fusion layer that computes the Kronecker Product to model pairwise feature interactions between histology and molecular features. B. For WSIs, per-patient local explanations are visualized as high-resolution attention heatmaps using attention-based interpretability, in which high attention regions (red) in the heatmap correspond to morphological features that contribute to the model’s predicted risk score. C. Global morphological patterns are extracted via cell quantification of high attention regions in low- and high-risk patient cohorts. D. For molecular features, per-patient local explanations are visualized using attribution-based interpretability in Integrated Gradients. E. Global interpretability for molecular features is performed via analyzing the directionality, feature value and magnitude of gene attributions across all patients. F. Kaplan-Meier analysis is performed to visualize patient stratification of low- and high-risk patients for individual cancer types.
See also Table S1.

