
Figure 3: Quantitative performance, local model explanation, and global interpretability analyses of PORPOISE on clear cell renal cell carcinoma (KIRC).
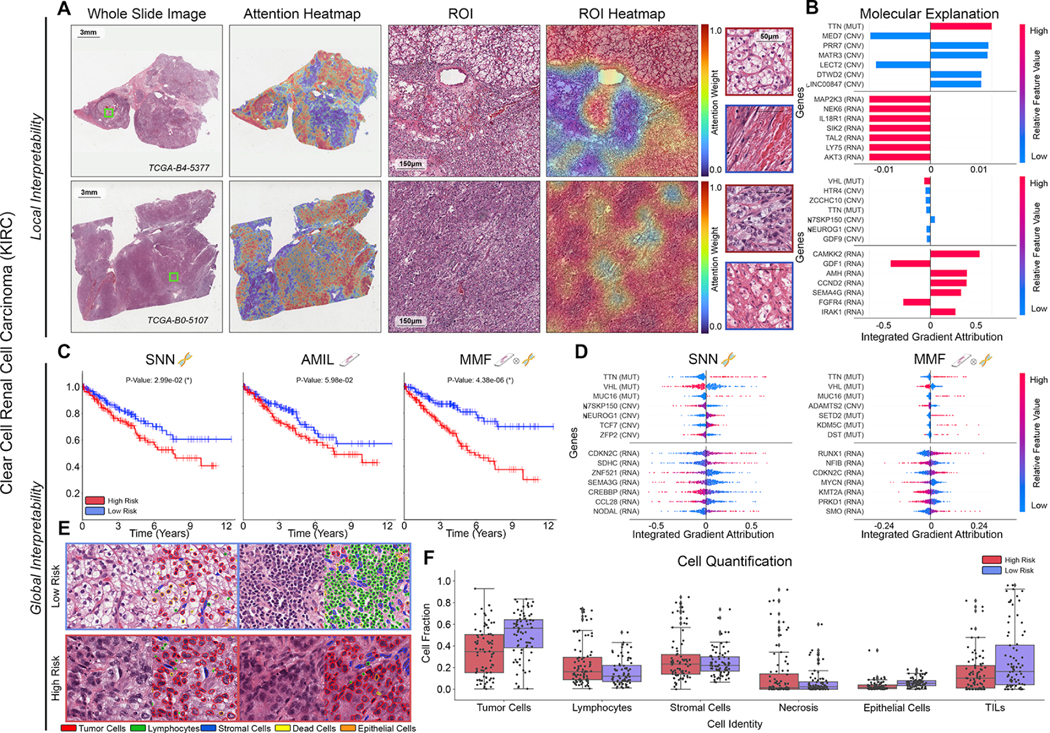
A. For KIRC (n=345), high attention for low-risk cases (top, n=80) tends to focus on classic clear cell morphology while in high-risk cases (bottom, n=80), high attention often corresponds to areas with decreased cytoplasm or increased nuclear to cytoplasmic ratio. B. Local gene attributions for the corresponding low-risk (top) and high-risk (bottom) cases. C. Kaplan–Meier curves for omics-only (left, “SNN”), histology-only (center, “AMIL”) and multimodal fusion (right, “MMF”), showing improved separation using MMF. D. Global gene attributions across patient cohorts according to unimodal interpretability (left, “SNN”), and multimodal interpretability (right, “MMF”). SNN and MMF were both able to identify immune-related and prognostic markers such as CDKN2C and VHL in KIRC. MMF additionally attributes to other immune-related / prognostic genes such as RUNX1 and NFIB in KIRC. E. Exemplar high attention patches from low-risk (top) and high-risk (bottom) cases with corresponding cell labels. F. Quantification of cell types in high attention patches for each disease overall, showing increased tumor and TIL presence.