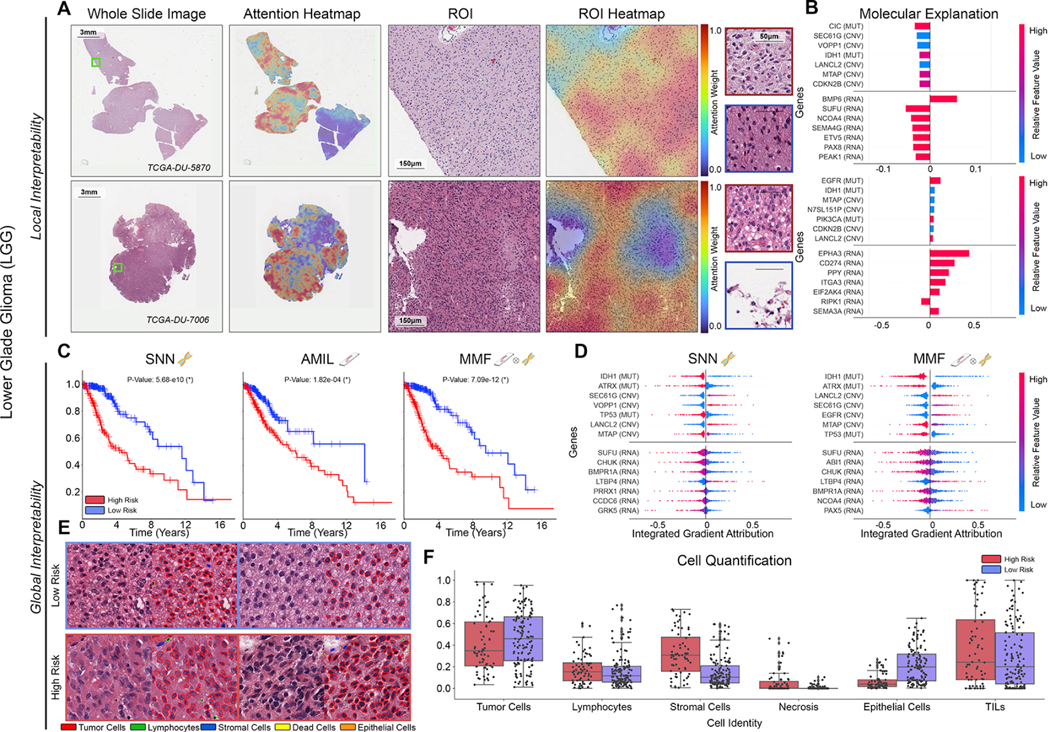
Figure 5: Quantitative performance, local model explanation, and global interpretability analyses of PORPOISE on lower-grade gliomas (LGG).

A. For LGG (n=404), high attention for low-risk cases (top, n=133) tends to focus on dense regions of tumor cells, while in high-risk cases (bottom, n=68), high attention focuses on both dense regions of tumor cells and areas of vascular proliferation. B. Local gene attributions for the corresponding low-risk (top) and high-risk (bottom) cases. C. Kaplan–Meier curves for omics-only (left, “SNN”), histology-only (center, “AMIL”) and multimodal fusion (right, “MMF”), demonstrating improvement in patient stratification in MMF. D. Global gene attributions across patient cohorts according to unimodal interpretability (left, “SNN”), and multimodal interpretability (right, “MMF”). SNN and MMF were both able to identify immune-related and prognostic markers such as IDH1, ATRX, EGFR, and CDKN2B in LGG. E. High attention patches from low-risk (top) and high-risk (bottom) cases with corresponding cell labels, showing oligodendroglioma and astrocytoma subtypes respectively. F. Quantification of cell types in high attention patches for each disease overall, with statistical significance for increased necrosis in high-risk patients.
