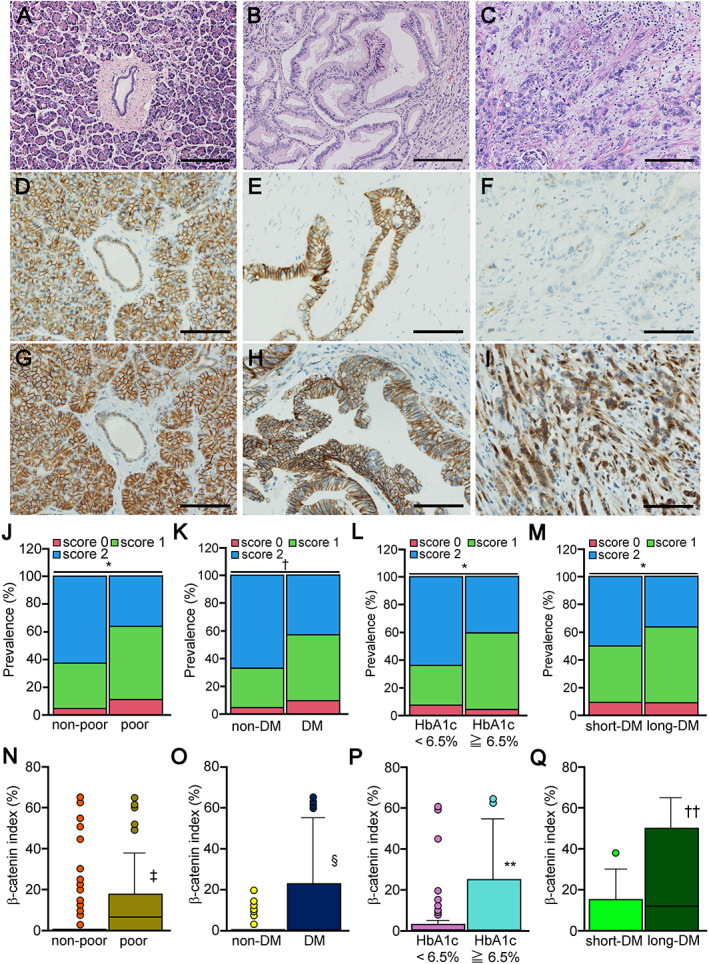
Figure 1.

Histology of pancreatic ductal adenocarcinoma and E‐cadherin expression. (A) In H&E sections, the epithelial cells in the duct showed no atypia and monolayered arrays in the nonneoplastic area. (B) PDAC cells exhibited an irregular ductal pattern with stromal reaction and were diagnosed as well or moderately differentiated adenocarcinoma. (C) PDAC cells exhibiting diffuse or solid growth were diagnosed as poorly differentiated carcinoma. (D) Immunohistochemical analysis revealed that E‐cadherin was strongly expressed on the cell membrane of nonneoplastic ductal cells. (E) Moderately differentiated PDAC cells showed robust E‐cadherin expression on the cell membrane, while (F) there was no E‐cadherin expression in poorly differentiated PDAC cells, judged as E‐cadherin loss. β‐Catenin was robustly expressed on the cell membrane of (G) nonneoplastic ductal cells and (H) moderately differentiated PDAC cells, while nuclear expression of β‐catenin was evident in (I) poorly differentiated PDAC cells. Semiquantitative evaluation of cancerous tissues revealed that (J) low E‐cadherin expression was significantly increased in poorly differentiated compared to non‐poorly differentiated tumors. The prevalence of low E‐cadherin subjects was significantly higher (K) in the DM group than in the non‐DM group, (L) the HbA1c ≥ 6.5% group than in the HbA1c < 6.5% group, and (M) the long‐DM group than in the short‐DM group. The β‐catenin index was significantly higher in (N) poorly differentiated tumors compared with non‐poorly differentiated tumors, the (O) the DM group versus the non‐DM group, (P) the HbA1c ≥ 6.5% group versus the HbA1c < 6.5% group, and (Q) the long‐DM group versus the short‐DM group. Significance: *p < 0.05, † p < 0.01 (chi‐square test), ‡ p < 0.01 versus non‐poor, § p < 0.01 versus non‐DM, **p < 0.01 versus HbA1c < 6.5%, and †† p < 0.01 versus long‐DM. Scale bars are 200 μm (A–C) and 100 μm (D–I).
