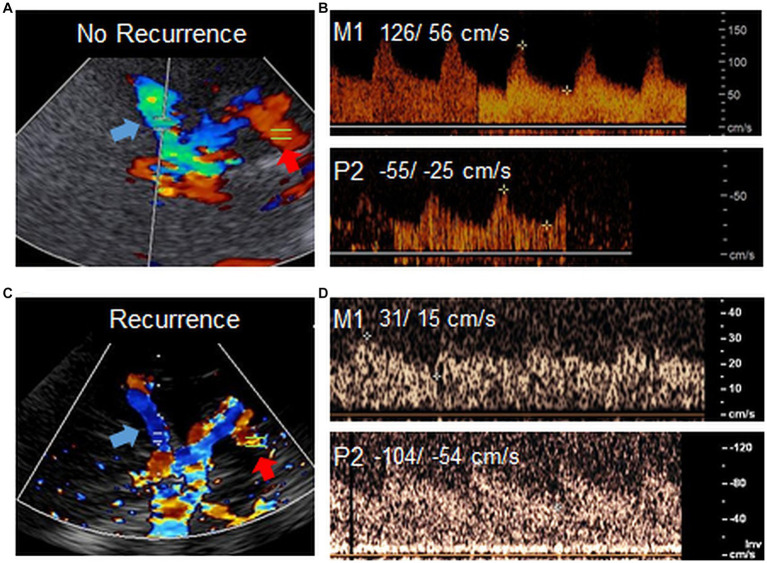
Figure 2.
High P2 flow in TCD. Example images of TCD in two patients with ICAO. TCD overview through transtemporal bone window in a patient (A) without ischemia recurrence and low flow in the P2 (red arrow) and (C) with ischemia recurrence and high flow in the P2 (red arrow). Blue arrows point to the MCA. (B,D) Respective doppler flow measurements derived from the ispilateral M1 or P2 in both patients. Flow velocities (PSV/ EDV) are shown in cm/s. The venous signal in the lower panel of D points to the basal vein of Rosenthal, which is sometimes detected together with P2 on ultrasound. Note that while in this example, flow in the M1 is particularly low in the patient with ischemia recurrence (C,D), this parameter was not associated with higher risk of recurrent ischemia in our previous study (8). Images were acquired with different ultrasound devices.

