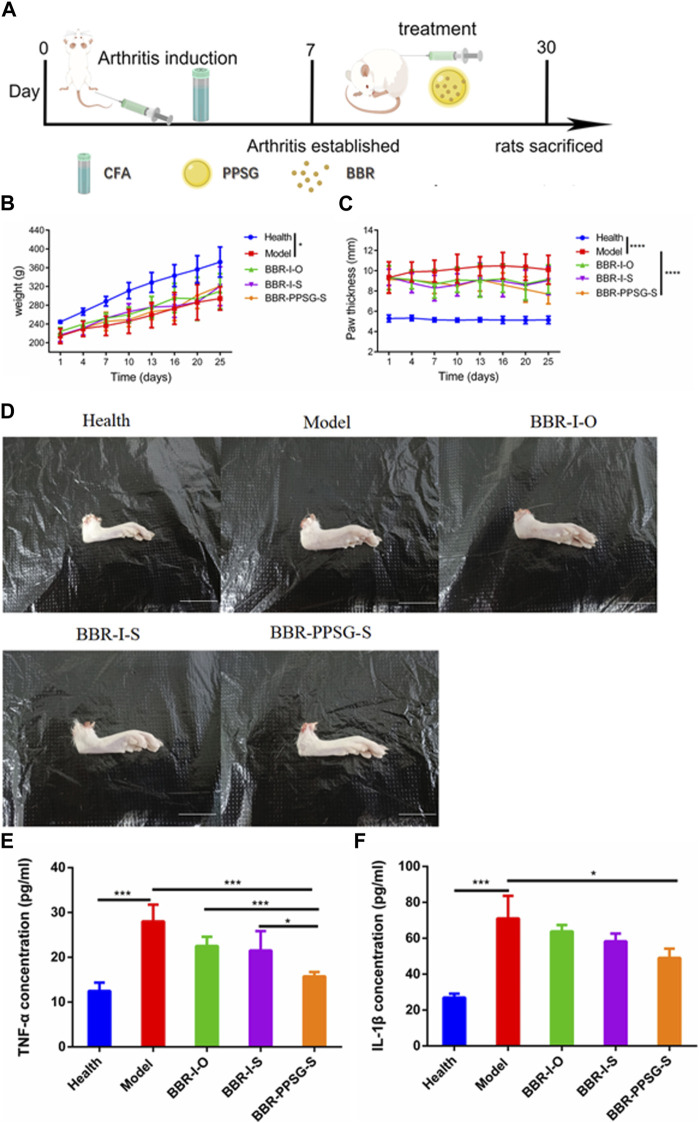
FIGURE 3.
Evaluation of therapeutic effect on AIA rats’ model. (A) Schematic diagram of arthritis induction and subcutaneous injection in rats. (B) Bodyweights of rats. (C) Paw thicknesses of rats. (D) Representative pictures of hind paw (Scale bar = 20 mm). (E) Serum levels of TNF-α. (F) Serum levels of IL-1β. Data represent mean ± SD (n = 7). *p < 0.05, **p < 0.01, ***p < 0.001, ****p < 0.0001.

