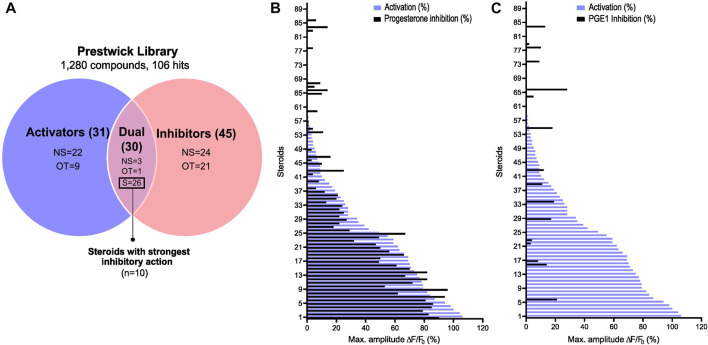
FIGURE 2.
Steroid screening results and steroid selection workflow. (A) Venn diagram showing the selection of steroids. A total of 10 steroids with the most potent activating and P4-antagonizing activity were selected. NS: non-steroids; S: steroids; OT: off-targets. Graphical representation of the 90 steroids for their ability to increase the [Ca2+]i and inhibit in (B) the P4- and in (C) the PGE1-induced Ca2+ response. Data are expressed as the mean percentage of maximal amplitude ∆F/F0, triggered by each steroid at 10 µM and normalized to P4 response at 2 μM, before (activation, purple) or after the addition of P4 or PGE1 (inhibition in black).

