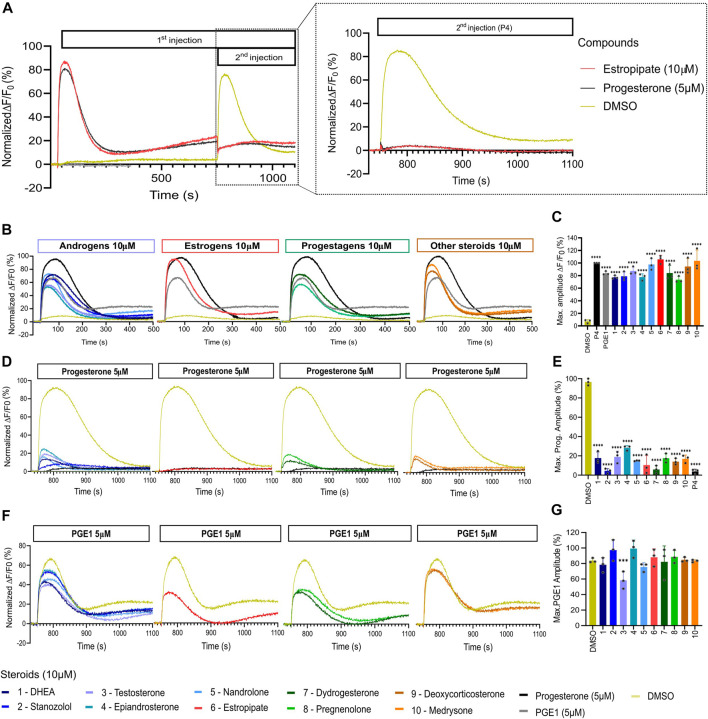
FIGURE 3.
Representative curves of [Ca2+]i in human sperm cells induced by diverse steroids. (A) Representative curves of Ca2+ influx before and after the first addition of steroids alone (10 µM), buffer (DMSO 0.5%) or positive control (P4 or PGE1 - 5 µM) and a second addition to assess the impact of steroids on the P4 or PGE1 response. (B) Representative Ca2+ signals evoked by each of the 10 steroids at 10 µM (P4 and PGE1 at 5 µM were used as corresponding positive controls). (C) Bar plots representing the maximum amplitude of the increase in [Ca2+]i shown in B normalized to DMSO (n = 3). (D) Representative Ca2+ signals evoked by P4 (5 µM) after 12 min incubation of each of the 10 steroids. (E) Bar plot showing the maximum amplitude evoked by P4 in D normalized to DMSO (n = 3). (F) Representative Ca2+ signals evoked by PGE1 (5 µM) after 12 min incubation of each of the 10 steroids. (G) Bar plot showing the maximum amplitude evoked by PGE1 in F normalized to DMSO (n = 3). p(***) <0.001; p(****) <0.0001.

