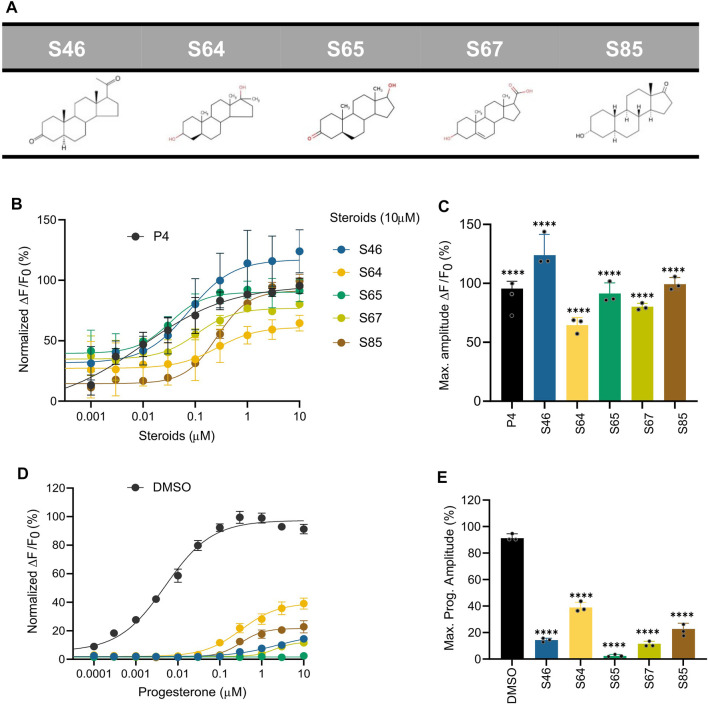
FIGURE 7.
Ca2+ response and P4-induced response in the presence of steroids predicted by pharmacophore and statistical modeling. (A) Chemical structure of the top five predicted steroids selected from the pharmacophore and statistical regression models. (B) Concentration-response curves comparing the potencies of the steroids with P4. (C) Bar plot of the maximum signal amplitude (∆F/F0 (%)) of the steroid-induced Ca2+ response in (B, D) Concentration-response curves comparing the inhibition of P4-induced [Ca2+]i influx by the top five predicted steroids at 10 μM, normalized to DMSO. The generated EC50s were the following: EC50 (P4): 0.005 µM, EC50 (S46): 2.254 µM, EC50 (S64): 0.322 µM; EC50 (S65): NA; EC50 (S67): 2 μM; EC50 (S85): 0.32 µM. (E) Bar plot of the maximum signal amplitude shown in D normalized to DMSO (n = 3). All steroids induced a significant inhibition of the response elicited by P4. Data are plotted as the mean of three independent experiments with error bars representing the SD and expressed as a percentage of the response elicited by P4 (10 µM) or DMSO (0.5%); p(****) <0.0001.

